The IELTS table and pie chart below was reported in May 2019 and also in September 2015. The topic is the imports of fish to the US from various countries and the value of these imports.
Note: The writing task 1 below is a reproduction of the original IELTS task 1 by an IELTS candidate. This means details will vary from the original. Even so, it gives a great chance to practise multiple tasks.
IELTS Writing Task 1: Table & Pie Charts 2019
IELTS writing task 1 (academic) reported 2019 and 2015.
Model Answer: IELTS Table & 3 Pie Charts
Instructions: The following model answer has been divided into sentences (A-H). Put them in the correct order to find a band score 9 model writing task 1 report.
A) In terms of the source of fish importation, Canada supplied the overwhelming majority in 1988 (60%) compared to China and other countries which provided only 13% and 27% respectively.
B) Regarding the table, the value of imports started at $6.57 billion in the first year, increasing to $8.52 in 1992 and reaching $10.72 in the last year.
C) Overall, the value of imports rose by just under double over the period given.
D) Likewise, imports from China rose over the period to reach 30% in 2000.
E) At the start of the period, the US imported fish predominantly from Canada but, by the final year, other countries had become the main source.
F) Conversely, by 1992, other countries had replaced Canada as the main supplier and made up 46% of all imports in 1992 and 42% by 2000.
G) The table shows the value of fish that was imported to the US (measured in billions of dollars) in 1988, 1992 and 2000, while the three pie charts illustrate the amount of fish that the US brought in from China, Canada and other countries in the same three years.
H) The imports from Canada then proceeded to fall to 28% in the final year.
Answers for Model Answer 2019
Click here to reveal answers: Answers
Answer: G C E B A H F D
See the model answer below to check how the above information is organised into paragraphs.
IELTS Model Answer: Table & 3 Pie Charts
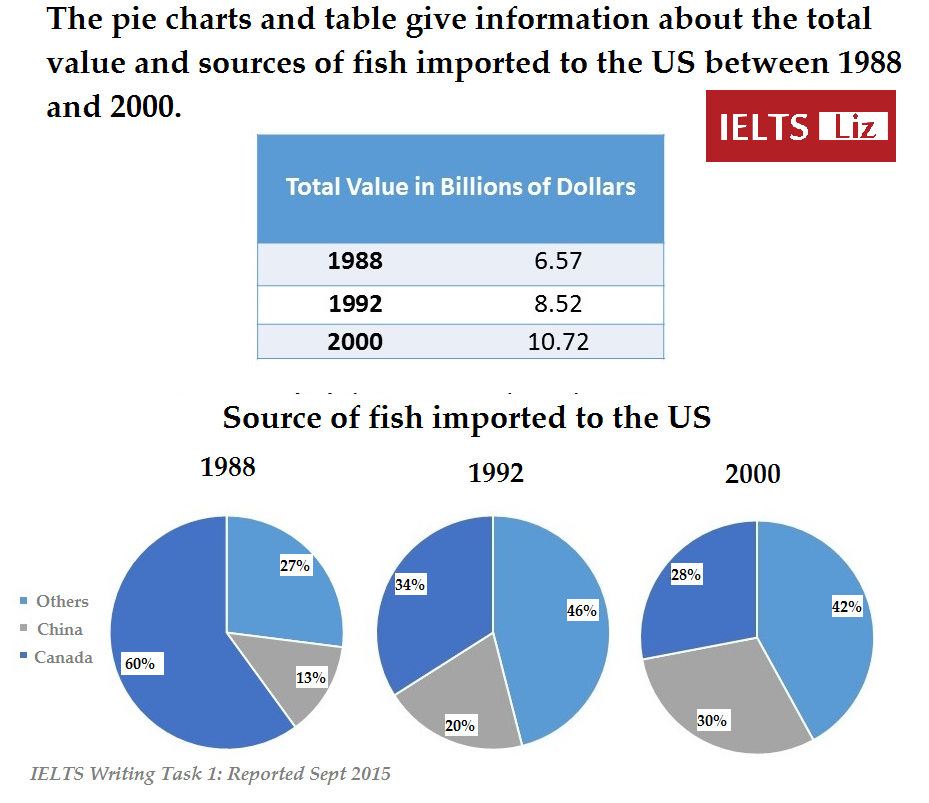
The table shows the value of fish that was imported to the US (measured in billions of dollars) in 1988, 1992 and 2000, while the three pie charts illustrate the amount of fish that the US brought in from China, Canada and other countries in the same three years.
Overall, the value of imports rose by just under double over the period given. At the start of the period, the US imported fish predominantly from Canada but, by 1992 other countries became the main source.
Regarding the table, the value of imports started at $6.57 billion in the first year, increasing to $8.52 in 1992 and reaching $10.72 in the last year.
In terms of the source of fish importation, Canada supplied the overwhelming majority in 1988 (60%) compared to China and other countries which provided only 13% and 27% respectively. The imports from Canada then proceeded to fall to 28% in the final year. Conversely, by 1992, other countries had replaced Canada as the main supplier and made up 46% of all imports in 1992 and 42% by 2000. Likewise, imports from China rose over the period to reach 30% in 2000.
Examiner Comment: Vocabulary is accurate and flexible. Paraphrase for the topic vocabulary =fish importation, provided, supplied, suppliers. Please note that the topic vocabulary provided by IELTS was also used and this is fine. Sentences are complex and accurate. The writer offers a good range of sentence structures and linking words (while, overall, regarding, in terms of, compared to, likewise, on the other hand). The overview statement is easy to find and contains the key features for both table and charts. Details are well organised into logical body paragraphs. It is fine that body paragraphs are not of equal length in report writing. This is estimated at band 9.
.
More IELTS Writing Task 1 Model Answers:
Click here to access more writing task 1 model answers and tips and free lessons: All IELTS Writing Task 1 Free Lessons etc
Note: GT candidates are not given such tasks. GT writing task 1 is a letter only. Click here: Essential Tips for IELTS GT Letter


liz thank you so much.
Thank You ! Explain well in simple way.
You’re welcome 🙂
Tnx so much dear mam g
Hi,
Thank you very much for giving extraordinary advice. It is very simple and accurately answer. I am from Mongolia.
Thanks, Баярлалаа
I’m glad my website is useful 🙂
Hi Liz.
Thanks for all of your helpful lessons.
I want to know if I can write(units are measured in percentage) in writing task one.
Please answer me thanks
It depends if you have already mentioned percentage. If you wrote “The chart illustrations the proportion of …”, it means you have already introduced percentage.
Do unequal sized body paragraphs result in a problem ?
For example, in this writing task, explaining the table is easier than the pie charts; hence, the body paragraph of the table explanation naturally becomes shorter than pie charts’ body paragraph.
Don’t The IELTS examiners decrease the score due to this unbalanced situation ?
Writing task 1 is a report, not an essay. Reports do not require equal length paragraphs. In writing task 2, however, if your main ideas in the body paragraph are not equally developed, it will affect your score.
Dear Liz, I’m following your lessons but I got one doubt in writing task 1. In bar and pie charts we should use past tense then what tense should be used for maps and diagrams?
You look at the dates given and use the appropriate tense. See all tips and model answers on this page: https://ieltsliz.com/ielts-writing-task-1-lessons-and-tips/
Hi Liz,
Can I use cumulative as a synonym for total in this context?
BE very careful with paraphrasing and only paraphrase when you are 100% sure it is correct. Your aim is not to paraphrase suitable words such as total – that word would be used only once and does not need to be paraphrased. Be more selective in your choices of paraphrases. All you need to do is show the skill of paraphrasing and avoid errors. Not all words should be paraphrased.
Thanks for the another good post!
Hello Liz,
I participated in the academic module of IELTS test today (September 7th 2019), and I thought I’d share the questions with you for other students’ further practice, so here they are:
speaking:
do you live in a house or an apartment? how long have you lived there? where it is located?
do you use social networking sites? how often? are there any drawbacks to these sites? do you think you will be using them more or less in the future compared to now? do you think they are useful for finding friends? what’s your attitude towards this kind of friendships?
Topic card: describe a person you know how has new or interesting ideas. you should say:
who this person is? how do you know him? why do you consider his ideas interesting or new?
follow-up questions: at what age children start having their own ideas? do schools play a role in pupils’ having ideas? who is famous in your country for having new ideas? do you think political leaders’ use of media for spreading ideas is helpful, good, or important?
writing task 2:
in some countries university students live with their family while they are studying. in other countries students leave their home to study in another city.
do you think the advantages of living with family outweigh the disadvantages?
Thanks for sharing 🙂
The three pie charts illustrates the sources of fish imported to the US in 1998,1992,2002 , while the table demonstrates the value of the imported fish.
overall, it can be seen that the imports value steadily increased through the period, however imports from the Canada continuously decreased.
In 1998, imports value was 6.57 billions of dollars. In this year US imported most of fish from Canada which is around 60%, when china imported 13% of the total. In 1992, US decreased imports of fish from Canada by 64 % of total imports, however increased imports from China with 20 % of the total. In both years US imported respectively 27 % and 46 % in 1988 and 1992.
In 2002, US imported highest amount of fish by 10.2 billions of dollars. This year US imported 28% from Canada which is the lowest imports from Canada, while US imported more fish from other sources by 42% of the total. US imported 30% from China.
Please do not expect a quick reply. I am overloaded with work and I work alone. This is not a question/answer service, my website is aimed at providing the 300 pages of free lessons and tips which are all accessed through the RED BAR at the top of the website.
Well actually Liz you have demonstrated IELTS very well but the best
Hi Liz, I’m shocked by this task 1 because this is the exact same task 1 I had on 07/06/2019 at Melbourne IDP computer-delivered test!!!!!
Why does that shock you?
This is awesome…you teach like you want to teach your self…sincere and simple.i found the lessons simple and easy to follow. thank you lizzy
You’re welcome 🙂
Hi liz your blog is interestingly helpful. Thanks alot.
Hi Liz!
Can I say: ‘Canada’s contribution to the US fish market dropped’ for example, as a way of substituting words like imports and exports?
Yes, definitely 🙂
I studied this text and one week later it was my Task 1 on IELTS. I almost had a loud laugh when I saw it. Thank you Liz, your tips helped me a lot!
That was lucky !! 🙂
Hi Luz, could you please share the general module tips as well. That would be very great full.
I’ve added the link to the page above. It’s given at the bottom of the post.
Thank you ,Liz!
Really beneficial 💐
Pls let me know as to how many paras are advisable. Can the body be in one or two paras
Always divide the body into paragraphs. Usually there are two but it is possible to have three sometimes. It depends on the data.
If we are given a pie chart with defined proportion but undefined unit for the numbers, how we should mention the unit of the numbers?
An example of this issue has been revealed in writing task 1 in Cambridge IELTS book 11, Test 4.
If the units are undefined, then you just refer to 25 units or 2,000 units. In the IELTS Cmabridge book 11, test 4, you will see that the numbers in the pie charts are actually percentages. The whole adds up to 100.
The table and piecharts illustrates the stastical figure of value of fish and the fraction of fish imported to US over the period of three different years 1988,1992 and 2000.
As can be seen from the table it is clear that the fish increased its value dramatically from 6.57% in 1988 and 8.52%to 10.72% in 2000.
Referring the piechart in terms of importation of fish US witnessed the disparity in fraction from different countries over the period.The majority of fish were provided by canada in 1988 arpproximtely 60% which decreased and reached to 39% in 1992 and 28% in 2000 respectively.China witnessed the more than one ten in total in 1988 and increased by the following two different years 20 % in 1992 and 30% in 2000.Whereas the fish exported from other different countries saw the greater disparity in proportion over the period of 11 year .The percentage went up overwhelmingly
from 27 to 46 respectively.
Hello liz…
Is it right to use grammatically…”fishes were imported” or I should use that “fish was imported”…i m confuse as graph shows that imported fish….more than one… So is it ok to use singular??
Pls make your point… It is very pleasant to hear you.
Thanks
“fish” is uncountable so you use the singular.
It helped me a lot
Hi lez
I would ask about how to write paragraph like what you showed why not starting with leaving a space for 5 letters?
If you are referring to indenting, there is no need to do so.
Dear Liz,
Ignore it, i got it.
Hi Liz, one of the many tips in Writing Task 1 is not to include all the details that you see. But in your sample answer, you discussed all of the details. Is it okay to describe all the details that you see in the charts for the sake of meeting the word number requirement? TIA!
You will see that not ALL percentages for the three pie charts are given. Information is grouped together.
hello liz,
thanks for your article, but I have a question
We don’t need to compare the pie chart with the table ?
Not necessarily. It depends on what they show. Usually they show different data so they don’t need to be compared. Many task 1 only require you to report details.
All the best
Liz
thank you for you replying
Love you and your blog 😀
Oh, can you mark my task 1 and task 2 test ? I will be on a test on 16 of april at IDP, but I don’t know who can help me mark my essay before testing ?
https://ieltsliz.com/ielts-essay-correction/
hi , wud appreciate if u could correct my sentense if its wrong –
by year 2000 there was fourfold rise in value of dollars
https://ieltsliz.com/liz-notice-2015-2016/
Hi Liz.I would like to clarify about the use of which,that and who when referring to a country.Which is the proper one?I have googled to seek for an answe but none really satisfies me.I believe you can help me.Thanks
https://ieltsliz.com/liz-notice-2015-2016/
Hi mam
Should we leave a line in writing after each passage or after completing passage we should end each in leaving half line and second line we should start with second passage?
https://ieltsliz.com/liz-notice-2015-2016/
I got the result for my IELTS, I got the worse score in writing. Though my overall band is 7 but in writing section I could get only 6.0. I was not expecting this. I need to start preparation again. I want at least 7 in all sections.
Hello liz,, your web is very helpful. Thank you very much for your hard work.
I have a question regarding the structure in option B.
“Regarding the table, the value of imports started at $6.57 billion in the first year, increasing to …. and reaching …. ”
This sentence began with “started” and why do yo use increasing and reaching instead of increased and reached after it?
Thank you
https://ieltsliz.com/liz-notice-2015-2016/
Hi Liz,
I am facing problem in writing task 1 when there are 2 different graphs are given. Writing all the information given in 2 graphs lead to exceeding the word limit. What can I do for this? Can I write some of the facts given in graphs in overview?
There is no upper limit. It is common to write around 190 words for task 1. With two charts, introduce both, put the key features of both in one overview and then put the details of each in separate body paragraphs. See my models with two charts.
Liz
Thank you so much! I am following your videos and using all the important tips described by you. They are really helpful, however, I sometimes write more than 190 words when there are 2 graphs given. How much it can affect my band score in task 1?
There is no upper word limit. 200 words is fine for two charts with lots of information.
Liz
Hello Liz… I have some problem with my writing task 1 they just give me the line graph and the line graph just only have 1 line and in this graph I have to write at least 150 words but I only wrote 120 words I want to extend my writing also but they only give 1 line it’s difficult to me extend do u have any suggest for me ?
Did this happen in your real IELTS test?
Liz
In writing task 2 academic: survey shows that many criminals have low education level. A way to decrease crimes is to educate people in prison to help them find a job when they leave prison. In what extent do you agree or disagree?
Thanks for sharing 🙂
thank you .. you are pretty , smart , and very helpful … best teacher on the NET .. only because of you , I might be able to score well.
It’s sad to see that teachers from India are a joke .. they didn’t even help me and my other mates .. just made money out of us :/
This is why western is education rocks .. Gotta bless the Brits like you. 🙂
I’m glad you’re enjoying my blog 🙂
Liz
Thank you so much, Liz! this is all I need for writing tactics .
Warm regards,
Hi Liz! Thank you for the lessons you provide for all of us.
I would like to clarify if British Council and IDP follows different format for writing task 1. Some people say that British Council has this format: Intro, Body, Conclusion. While IDP follows this: Intro, Conclusion (Overall,..), Body(details).
I followed the format you used in your examples.
How true is this? Thank you.
The examiners that mark your writing are trained in the same way for IDP and BC. In fact, some examiners work at both places. The test is the same and the marking is the same.
Liz
Hi Liz
Thank you so much for your valuable tips.
I just got my target today – 6.5
you are amazing and simply superb.
Well done!! A good score 🙂
Liz
i was interested to subscribe your writing task video course but plz confirm whether all writing task 2 are covered or individually …
No, at present I have only two lessons available to buy. I will add one more next month and then two more next year. You can buy them individually.
Liz
Thank you very much for your lessons. I don’t understand one statement of this writing. ” By 1992, other countries….made up 46% of all imports in 1998 and 42% by 2000. I don’t get why you have written 1998 ?
Thank you.
Just a typo. Thanks for spotting it.
Liz
Dear IELTs team:
I have one more month for my ielts exam. However, I find that my reading is quite poor. If you have a special technique which I can adapt to and learn from It will be appreciated. Great thank !!!
Pich
All tips are on the main reading page of this blog.
All the best
Liz
Hi Liz,
I am following your posts as my exam is on 8th October, could you please post writing task for General Test?
Thanks,
Yasir from Vietnam 🙂
There are tips and practice letters on this page: https://ieltsliz.com/ielts-writing-task-1-lessons-and-tips/
Liz
Thanks Liz.
Thanks mam for your amaging website..im learning a lot from here. 🙂
Dear Ms. Liz,
Thank you so much your information. your writing is useful me . it is easy understand with your ideal description.
By the way, you can guide method listen rose level. i need iels 6.5 but existing i gain 4.0. how long i can is 6.5 if i follow your instruction
Best regards,
Gloria Tran
Best regards
Hi Liz,
Thank you so much for providing us helpful information on how to pass the ielts. You’ve been a great help for me starting from my day 1 of review until now.
I made my own version of that report. I hope you can put some remarks and corrections, if you have available time. Thank you.
The pie charts and table illustrate the overall worth of imported fish and the countries that supplied the US in 1988, 1992 and 2000.
It can be clearly seen that in 1988, Canada was the top supplier of fish but as the years passed by, it was overtaken by the other countries. The highest value of fish importation was noted in 2000.
By 1988, China exported 13% of fish to the US and increased significantly to 20% and 30 % in the following years ( 1992 and 2000, respectively). On the other hand, Canada’s fish import had the greatest percentage in 1988 (60%),then, it decreased almost half in 1992. By 2000, Canada’s supply of fish went down to 28%.
The other countries noted to had 13% supplied fish in 1988 and progressed to 30% by 2000.
In terms of the total value of imported fish, the year 2000 got the highest, amounting to $10.72 billion dollars. Followed by $ 8.52 billionn (1992) and $6.57 billion (1988). The worth of imported fish increased by more or less 2% as the time passed by.
***** thank you so much..
Sorry I don’t comment on writing. But I will say just two things: Make your overview clear – state with “Overall”. Make your paragraphs clear – leave an empty line between them.
Liz
Thank you so much, Liz:)
You are really an inspiration. Most of my writings are inspired by your ideas and techniques.
May God bless you:)
You’re welcome 🙂
simple, superb and spotless
Thank you very much Liz
Thank you very much for your dedication Liz. I am a regular reader of your website :-). With best wishes from Vietnam.
You’re welcome. Glad to help someone from Vietnam 🙂
Liz
Hi,
When are you taking exam? I have booked on 8th October.
Thanks
Hey Liz…
Thank you very much.You have amazing teaching skill.I discoverd your webpage 2 days ago.I was searching webpage,knowledge like yours.Thank you again.
Simple enough