Creating a Model Answer for IELTS writing task 1.
Many students asked me to write a full model answer for this bar chart which was used in my lessons last week.
Below you will find 10 sentences. Put them in order to create a high band score model answers.
Source of Bar Chart: https://www.english-in-chester.co.uk
IELTS Bar Chart Model: Sentence Ordering
Put the sentences in order to make a full answer. Download Sentences: bar chart model lesson
- A) Teenagers spent 25 hours on watching television in 2002 which increased to almost 40 hours in the final year.
- B) The other pursuits showed a decrease in hours, except watching DVD’s which fluctuated.
- C) Going to pubs and discos, watching TV and shopping all showed an increase in the number of hours teenagers spent on these activities.
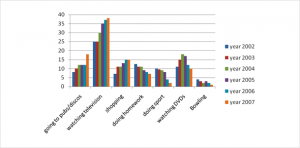
- D) The bar chart illustrates how many hours adolescents in Chester spent on seven activities each week between 2002 and 2007.
- E) While teenagers occupied 10 hours doing homework in 2002, this figure dropped to just over 5 in 2007.
- F) The number of hours teenagers dedicated to watching DVD’s was only 10 hours in first and final years, but reached a peak of over 15 hours in 2004 and 2005.
- G) Overall, the most popular activity over the period given was watching TV, whereas bowling was the least favourite.
- H) Bowling was under 5 hours throughout the entire period declining by about 4 hours in total.
- I) Both going to pubs and discos, and shopping more than doubled in hours from over 5 to over 15 and from over 5 to exactly 15 respectively.
- J) Playing sport fell more dramatically from 10 hours to around 3 hours.
Notice how many sentences are used to create a full model answer. IELTS writing task 1 does not require many sentences. There are NO fixed number of sentences for writing task 1, but you can see that you do not need many to write a high score answer.
Answers
Answers are now available.
Click below for the Answers
AnswersD, G, C, B, A, I, E, J, H, F
The bar chart illustrates how many hours adolescents in Chester spent on seven activities each week between 2002 and 2007.
Overall, the most popular activity over the period given was watching TV, whereas bowling was the least favourite. Going to pubs and discos, watching TV and shopping all showed an increase in the number of hours teenagers spent on these activities. The other pursuits showed a decrease in hours, except watching DVD’s which fluctuated.
Teenagers spent 25 hours on watching television in 2002 which increased to almost 40 hours in the final year. Both going to pubs and discos, and shopping more than doubled in hours from over 5 to over 15 and from over 5 to exactly 15 respectively.
While teenagers occupied 10 hours doing homework in 2002, this figure dropped to just over 5 in 2007. Playing sport fell more dramatically from 10 hours to around 3 hours. Bowling was under 5 hours throughout the entire period declining by about 4 hours in total. The number of hours teenagers dedicated to watching DVD’s was only 10 hours in first and final years, but reached a peak of over 15 hours in 2004 and 2005.
Word count = 194 (you do not need to write the word count in your test)
Paragraphing Tips
- It is possible that the last sentence about DVD’s could be written as a separate paragraph.
- Always have an introduction and overview. They must be separate statements.
- Always divide your body paragraphs into two (or sometimes three) paragraphs.
- Your body paragraphs should be logical and help to highlight similarities and differences.
- Learn an empty line between paragraphs to make them clear and easy to see. This is not a requirements, it is a recommendation. If your paragraphs are not easy to see, your score might be lower.
All the best, Liz


The given bar chart illustrates that the hours per week that adolescents spend doing specific activities such as going to pubs, watching television, shopping, doing homework, doing sports, watching DVD’s and bowling between the year 2002 to 2007 in Chester.
Overall, the most favorite activity over the period is watching the Television and the least one is Bowling. Going to pubs/discos, shopping, and watching Television all showed an increase in the number
of hours spent by teenagers. The bar chart shows a decrease in the number of hours spent on doing homework and bowling however the watching DVD’s has fluctuated.
In the year 2002, teenagers spent near 10 hours by going to pubs and discos and continues to increase in the time year by year, it was almost 20 hours in the final year. In the year 2002, 25 hours of a week spent by teenagers on watching Television and remain the same in the year 2003 but in the year 2004 it rose and recorded as 30 hours and over 35 hours a week in the final year. Over 5 hours per week spent on shopping in the year 2002 and hiked it to 10 hours in the very next year and it remain the same for the next year then it rose again up to 15 hours in the year 2006 and 2007.
By considering other activities, 12, 10 hours of a week spent on homework and doing sports by the teenagers in year 2002 and in the final year it reached 8 hours and 3 hours respectively. The activity of watching DVD’s was variable, It was the same in the beginning and the final year but fluctuating in the other years. The less hours of a week spent on the Bowling by youngsters, in the year 2002 it was recorded as 3 hours and the final year it was just 1 hour.
The given bar chart provides information about the number of hours spent by adolescents in Chester each week between 2002 and 2007.
Overall, as it can be seen that the most popular activity was watching television while bowling was the least favourite. Going to pubs/discos and shopping gradually increased throughout the given period as opposed to the hours spent on doing homework and doing sports. Furthermore, watching DVDs reached a peak in the middle of the period after which gradually declined.
In terms of the most significant feature of the chart, the number of hours spent watching television was high above every given activity. It started at exactly 25 hours per week in the first year and reached its highest point at about 38% in the final year. In stark contrast, bowling became the least popular activity which was under 5 hours throughout the entire period declining precipitously by about fours in total.
Turning to the other activities, the hours spent on shopping witnessed a gradual rise from around 7 hours to exactly 15 hours in the final year. Likewise, going to pubs/discos had considerable growth in the first three years 8 hours after which remained stable for another three years before drastically surged in 2007 to nearly 18 hours per week. In contrast, the hours spent on doing homework and doing sport saw a steady decrease to reach at 8 hours and 3 hours, respectively. In addition to watching DVDs, the trend demonstrated a notable increase to reach a peak of around 18 hours by 2004 before declined to about 10 hours where it began at the start of the period.
Just a quick tip: don’t use “/”. You need to write everything in full – going to pubs or discos.
Dear Liz,
Thank you for your helping and I hope you will have time to check my essay.
The bar chart illustrates the six different functions that adolescents spend their time in Chester between 2002 and 2007. Units are measured in the number of hours each week.
Overall, it can be seen the most popular activity of teenagers spend time recorded on watching TV. Going pubs and discos and watching DVD’s made up significant an increase, while the less attractive activity for full of ages was on bowling.
Teenagers spent 25 hours watching television in 2002, which increased almost 40 hours in the final year. The number of teenagers dedicated to watching DVDs was only 10 hours first and final years but, reach a peak over 15 hours between 2004 and 2005. Both going pubs and discos and shopping from over 5 to over 15 to exactly 15 respectively.
The number of hours adolescents doing homework recorded just over 10 in 2002, this figure dropped to just over 5 in 2007. Doing sport was exactly 10, however, rapidly decreased form under 5 to in the final year. The lowest attractive activity of teenagers on bowling was under 5 hours throughout the overall period decline by about 4 hours in total.
Sorry I don’t offer marking.
Hi liz, your videos are helpful especially to someone who is skeptic about the exam. Let me share my writing part 1 and hope you have time to read and give some points to improve. Thank you.
The bar chart demonstrate the time allotted per week that teenagers spend doing certain activities from 2002-2007 in Chester.
Overall, watching television consumes the most of the teenagers time consistently from the year 2002 up to 2007. While playing bowling has the least used hours in 2002 and further decline in 2007.
In 2002-2003 adolescent allotted their time watching television for about 25 hours per week and it has gradually increased to 30 hours respectively in 2004-2007.
Watching DVD’s is the second activity were teenagers spend time. 15 hours per week in 2004 was being used and declined to 10 hours in 2007.
On the other hand, the least activity were the teenagers consumed less time was playing bowling. From 2002 about 4 hours was spend per week and significantly declined to less than 1 hour in the year 2007.
From the year 2002-2006 other activities such as going to pubs, shopping, doing home work, and doing sports were consistently enjoyed in less than 10 hours. While in 2007, only going to pubs/discos the number of hours spend jumped rapidly around 15 hours.
Hi Liz,
I have written this task by myself.
Please, can you correct my task? so I can know my mistakes, and how much score do I get?
The bar chart illustrates how much teenagers in Chester spend there time every week doing particular activities between 2002 to 2007.
Overall, it is clear that, watching television was exceeded than other activities. In fact, watching television was the most significate than in other activities. While playing bowling was the least popular activity throughout the years, teenagers were spent there time less than 5 hours per week in bowling between 2002 to 2007.
There are four activities that had a similar period of time between 2002 to 2005. In terms of watching television teenagers spend 25 hours between 2002 to 2003, but in 2007 they spend more time approximately 40 hours per week. Furthermore, between 2004 to 2005 teenagers spend time going to discos around 10 hrs. However, after two years in 2007, they spend more time about 15 hrs.
With regard to shopping, the majority of teenagers between 2006 to 2007 preferred to spend their time going shopping was exactly 15 hrs. The similarity, between 2003 to 2004 was teenagers had spent around 10 hrs for going shopping and doing their homework.
Dear Liz,
I have written this task as follows:
The below chart illustrates the number of hours that young people have spent on various activities from 2002 to 2007 on a weekly basis.
Overall, watching TV has remained the most popular activity for the whole span, while bowling has been the least favorite one. Not only is watching TV the highest figure in terms of spending hours, but it has seen a dramatic rise over the years.
Besides watching television which has reached a peak of about 37 hours in 2007, the other leisure activity of going to pubs/discos has increased from 7 hours in 2002 to about a maximum of 18 hours in 2007. Watching DVDs on the other hand has lost its popularity after reaching a peak of 18 hours in 2004 evident by falling to 10 hours in the final year.
In terms of educational activities, doing homework has been on a constant decline over time, changing from about 12 hours per week to about 7 hours in 2007. Similarly, athletic activities have seen the same reducing pattern but with a more dramatic decline after 2005, sitting on about 2 hours in 2007.
This is quite helpful dear Liz.
My aim is to achieve band 7.5 for PLAB.
I have been doing practice and your website is helping me a lot , I have learned so many new things and tips to possibly achieve good band.
Cheers.
I wish you good luck! 🙂
Thanks liz,i used to go through your lessons frequently and that’s really a complete stuff. 100% SATISFIED with your teaching. God bless you🙂😇
There is no conclusion paragraph for task 1?
No. An overview is required which contains all key features.
The bar chart illustrates six different activities teenagers spent their time on them, measured by hours weekly in Chester between 2002 to 2007.Overall, watching television was the most popular activity while bowling was the least interesting activity across all years.
As is presented, 25 hours have been spent on watching TV at 2002 to increase to almost 37 hours in 2007. On the other hand, bowling was below 4 hours within the given period to fell to 1 hour in 2007.
Regarding going to pubs/discos and shopping activities stood at 7 and 6 hours respectively to continue rising. 2007 witnessed more hours spent on discos by 10 hours and 15 hours weekly on shopping.
Doing homework and spot both were falling down except sport hours dropped more dramatically than homework hours. While, watching DVDs was just above 10 toreach the trough of 17 hours in 2004 and leveled off at 10 hours.
Thank you Liz for he excellent website
My answer
The bar chart illustrates the time spent by teenagers in different activities in Chester from 2002 to 2007. The unit of time used is hours per week.
At a first glance, it is clear that the teenagers have been gradually spending less time on physical activities such as sports or bowling. Other activities, that have shown increasing involvement over the years include going to pubs/discos and shopping. Further, their favourite pastime has been watching television and its popularity has been on the rise.
Among teenagers in Chester, the favourite leisure activity had been watching television. In 2002, they spent 25 hours per week on it and this gradually increased to around 37 by 2007. Other activities that had gained popularity include shopping and going to pubs or discos. In 2002, an average teenager spent close to 7 hours shopping and this rose gradually to 15 hours per week by 2007. When it came to going out to pubs or discos, teenagers spent approximately 8 hours per week in 2002. While this rose to around 12 hours by 2004, it remained so for 3 years until a steep incline to around 18 hours per week in 2007.
Teenagers had been spending less amount of time doing homework. In 2002, they spent close to 12 hours per week on homework and this came down to around 7 hours per week by 2007. Similarly, the time spent on sport came down from 10 hours per week in 2002 to close to 2 in 2007. Bowling was always the least popular activity and the time spent on it came down from approximately 4 hours per week to just about an hour per week.
Teenagers did spend some time watching DVDs and spent around 11 hours a week on them in 2002. A steep rise was followed by a similar decline in the interest in DVDs and by 2007, teenagers spent 10 hours a week on watching DVDs.
The bar chart illustrates the hours teenagers spent weekly on six different activities in chester, from 2002 to 2007.
Overall, watching television was the most popular activity and bowling was least interesting in the given period of time.Going to Pubs/discs, shopping and watching DVDs were also given considerable amount of time while the rest shown decline year after year.
Watching TV was given 25 hours per week for the first two years which rose to almost 35 hours in 2007.Going to pubs/discs showed almost 15 hours increase from 2002 to 2007.Secondly shopping also increased from just above 5 hours in 2002 to 15 hours in 2007 and watching DVDs increased for the first three years before declining to 10 hours in 2007.
Doing Home work and sport descent over the period of time, Home work reaching just above five hours and sport well below 5 hours by 2007.Bowling was given least of the time , it degraded from well above 5 hours to well below 5 hours by the end of 2007.
Hello liz, kindly check my answer for this take and guide me to know the areas of improvement i should practice.
Thanks for everything you are doing for us.
The bar chart illustrates how many hours weekly spent by adolescents on seven activities ( going to pubs/discos, watching TV, shopping, doing homework, doing sports, watching DVDs and playing bowling )in Chester over 6 years from 2002 to 2007.
Overall, watching television was the most popular activity over the given period, whereas the bowling activity was the least one. Watching Tv, going to pubs/discos, shopping and going to pubs/discos all showed increase in the number of hours was spent by teenagers. Other activities showed decrease in the number of the hours except watching DVDs which fluctuated.
Adolescents spent 25 hours watching television in 2002 and 2003 then this number gradually increased to 30 hours in 2004 and peaked in 2007 by 37 hours. On the other hand shopping figures showed modest increase from 6 hours in 2002 to 15 hours in 2006 then plateaued in 2007 as well as going to pubs/discos depicted 8 hours in 2002 and gradually increased to 12 hours in 2004 then plateaued for 3 successive years and surged at the end of this by 19 hours.
Doing homework activity showed modestly decrease from around 12 hours to 7 hours in 2007 whereas doing sport plummeted from 10 hours to around 3 hours weekly in the same year. Bowling was below 5 hours within the whole period and dipped to 1 hour in the final year
Hello Lisa,
Thank you for your help and support. I have started watching your videos recently. I feel writing is bit more difficult. Could you please guide me on the below essay.
The bar chart provides with the information for the teenagers carrying out different activities (going to pubs or discos, watching television, shopping, homework, sports, watching DVDs and bowling) from the years 2002 till 2007. The unit is measured in the number of hours per week.
Overall, the most popular activity among the teenagers is watching television while the bowling remains the least popular in all the years. Additionally, certain activities have gradually decreased as the years passed by namely, doing homework, sports and bowling.
Pubs, watching television, shopping and watching DVDs have seen a considerable amount of increase with the years passing by with the peak of year 2007 for pubs and discos which showed a sudden increase of about 17 hours in a week.
Watching DVDs also has a volatile increase It showed a gradual increase till the year 2004 and later with significant decrease to almost 10 hours of a week.
The bar graph demonstrates details regarding the number of hours that teenagers spent weekly in doing different kinds of activities in Chester from 2002 to 2007.Generally it can be seen that there was an increase in the length of time that teenagers spent on going to pubs/discos so as with watching television and shopping over the given periods.However doing homework,sports and bowling experienced a decline in popularity while watching DVDS fluctuated in the amount of time spent.Watching television became the most favourite pastime having the most number of hours spent in contrast with bowling which was the least preffered activity.
In detail it is apparent that the amount of time spent in watching television stood at 25 hrs in the first 2 years.The figure rose up to peak at about 30 hrs in the final year.Similarly,going to pubs/discs and shopping more than doubled in the number of hours spent from 5 to over 15 and from over 5 to exactly 15 respectively.
Meanwhile, the amount of time spent on making homework and playing sports experienced a decline from 12 hrs to 7 hrs and 10 hrs to 3 hrs respectively over the the 6-year period so as with bowling from 4 hrs in the beginning to at least 1 hr in the final year.
On the other hand ,the number of hours spent for watching dvds stood at 10 hrs for both initial and last year but experienced to peak at 18 hrs in 2004.
Can you change adolescents to teenagers
Yes.
What a blessed teacher Liz..
The bar chart illustrates that how many hours adolescents in Chester utilised on seven activities each week between 2002 and 2007.
Overall, teenagers dedicated their maximum hours for watching television which was their favourite activity, whereas bowling was their least favourite.
It is clearly seen that teenagers spent 25 hours for watching television in 2002 but after five years it was at peak level of almost 40 hours. Both going to pubs/discos and shopping, juveniles occupied over 5 to over 15 and over 5 to exact 15 respectively. There was also a one activity which was bowling, it was under 5 hours throughout the entire period declining by about 4 hours in 2007.
In addition, adolescents utilised their more than 10 hours for doing school work in 2002 but, with small changes in next years, it decreased by 6 hours in 2007. 10 hours spent by juveniles in 2002 but after dramatic drop it was just 3 hours. Utilisted time on watching DVDs was 10 hours in 2002 but after fluctuation in hours it was again at same rank in 2007.
Mam plz check my mistakes and give me band score plzzzz ……bcz I am preparing my exam at home
should i leave a space (about 1 cm) before each topic sentence
You can either indent your first word of the paragraph or you can leave one line empty between paragraphs. I prefer the second option because it is easier for the examiner.
The provided bar graph demonstrates the total time spent by the adolescents on seven different activities each week from year 2002 to 2007.
Overall, the activities where the teenagers spent plenty of time were going to pubs/disco, watching television, and shopping. While on the other hand doing homeworks, playing sports, and bowling were the least preferred activities by the adolescents. However, the hours spent in bowling fluctuates each year.
The Juveniles spend 25 hours watching television in the year 2002 which was increased in the final year (2008). Meanwhile, going to pubs/discos teenagers spent above 5 hours in 2002 which remained stable in the next 3 years (2004,2005,2006 respectively) with approximately 12 hours in this activity (pubs/discos) that follows having a rapid hours of growth in year 2007. Same as going shopping, the adolescents spent more than 5 hours in 2004 which was increased in the final year.
Moreover, teenagers spent 10 hours doing their assignments in year 2002 which dropped nearly 6 hours by year 2007. Similarly in playing sports which dramatically decreased from 10 hours to approximately 2 hours by the final year. Meanwhile the bowling activity always had least hours spent by the juveniles which remained less than 5 hours from 2002 to 2007. The number of youngsters that watched Digital VideoDisc reached approximately 10 hours in the first and final year and increased above 15 hours in year 2004-2005.
Wowwww
This is impressive!
Hi Liz, although it’s a very high band scoring answer but why didn’t you use any connective word in body paragraphs
Linking words used: Overall, whereas, while, but. In a short report, that is actually reasonable. To add more, you could use “Furthermore, In addition”. Using any more would be an over-use of linking words which would lower your score. You don’t need a linking word in each sentences. There are only 10 sentences, this model answer used 4. If you use 6, that’s great.
Thanks you are always excellent, mam
D-G-C-B-A-H-I-E-J-F
My guess is: D- intro,
G and B – overview,
C,I,A,E – BP 1,
B,J,H,F – BP 2.
Introduction: D
Overview: G
Body Paragraph 1: C,I, A, E
Body Paragraph 2: B, F,J, H
Good stuff for writing, Liz! Thank you!
D-G-C-I-A-E-J-H-B-F
Introduction -D
Overview-G
Paragraph 1-A C I F
Paragraph 2-E HI B
D G C B A I E J F H
Introduction-D
Overview-G H
Paragraph 1,B,C,I,F
paragraph 2, E,H,J
Conclusion, B
The bar chart illustrates how many hours adolescents in Chester spent on seven activities each week between 2002 and 2007. Overall, the most popular activity over the period given was watching TV, whereas bowling was the least favourite.
Going to pubs and discos, watching TV and shopping all showed an increase in the number of hours teenagers spent on these activities. The other pursuits showed a decrease in hours, except watching DVD’s which fluctuated.
Teenagers spent 25 hours on watching television in 2002 which increased to almost 40 hours in the final year. While teenagers occupied 10 hours doing homework in 2002, this figure dropped to just over 5 in 2007. The number of hours teenagers dedicated to watching DVD’s was only 10 hours in first and final years, but reached a peak of over 15 hours in 2004 and 2005. Both going to pubs and discos, and shopping more than doubled in hours from over 5 to over 15 and from over 5 to exactly 15 respectively. Playing sport fell more dramatically from 10 hours to around 3 hours. Bowling was under 5 hours throughout the entire period declining by about 4 hours in total.
D G C E I F B J A H
The bar chart illustrates how many hours adolescents in Chester spent on seven activities each week between 2002 and 2007.
Overall, the most popular activity over the period given was watching T.v whereas bowling was the least favorite.
Going to pubs and discos, watching T.v and shopping all showed an increase in the number of hours teenagers spent on these activities While teenagers occupied 10 hours doing homework in 2002 this figure dropped to just 5 in 2007. Both going to pubs and discos and shopping more than doubled in hours from 5 to over 15 and from over 5 to exactly 15 respectively. The number of hours teenagers dedicated to watching DVDs was only 10 hours in the first and final years, but reached a peak of over 15 hours in 2004 and 2005. The other pursuits showed a decrease in hours, except watching DVDs which fluctuated. Playing sport fell more dramatically from 10 to around 3hours.
Teenagers spent 25 hours on watching Television in 2002 which increased to almost 40 hours in the final year. Bowling was under 5 hours throughout the entire period decling by about 4 hours in total.
D G C E I F B J A H
D C I A E J H B F G
The bar chart illustrates how many hours adolescent in Chester spent on seven activities each week between 2002 and 2007.
Overall, the most popular activity over the given period was watching TV, whereas bowling was the least favourite.
Going to the pubs and discos, watching TV and shopping all showed an increase in the number of hours teenagers spent on these activities. Both going to pubs and discos, and shopping more than doubled in hours from over 5 to over 15 and from over 5 to exactly 15 respectively. Teenagers spent 25 hours on watching television in 2002 which increased to almost 40 hours in the final year.
While teenagers occupied 10 hours doing homework in 2002, this figure dropped to just over 5 in 2007. The other pursuits showed a decrease in hours, except watching DVD’s which fluctuated. The number of hours teenagers dedicated to watching DVD’s was only 10 hours in first and final years, but reached a peak of over 15 hours in 2004 and 2005. Bowling was under 5 hours throughout the entire period declining by about 4 hours in total. Playing sport fell more dramatically from 10 hours to around 3 hours.
According to my opinion, the correct order is D, G, C, B, A, I, E, J, F.
1. Introduction (D)
The bar chart illustrates how many hours adolescent in Chester spent on seven activities each year between 2002 and 2007.
2. Overview (G, C, B)
Overall, the most popular activity over the period given was watching TV, whereas bowling was the least favorite. Going to pubs and discos, watching TV and shopping all showed an increase in the number of hours teenagers spent on these activities. the other pursuits showed a decrease in hours, except watching DVD’s which fluctuated.
3. Body Paragraph 1: Categories that increased over time (A, I)
Teenagers spent 25 hours on watching television in 2002 which increased to almost 40 hours in the final year. Both going to pubs and discos and shopping more than double in hours from over 5 to over 15 and from over 5 to exactly 15 respectively.
4. Body Paragraph 2: Categories that decreased over time (E, J)
While teenagers occupied 10 hours doing homework in 2002, this figure dropped to just over 5 in 2007. Playing sport fell more dramatically from 10 hours to around 3 hours.
5. Body Paragraph 3: Category that fluctuated (F) *)
The number of hours teenagers dedicated to watching DVD’s was only 10 hours in the first and final year but reached a peak of over 15 hours in 2004 and 2005.
*) Note: Body Paragraph 3 can also be added at the end of Body Paragraph 2.
The bar chart illustrates how many hours adolescents in Chester spent on seven activities each week between 2002 and 2007. Overall, the most popular activity over the period was watching TV, whereas howling was the least favourite.
Teenagers spent 25 hours on watching television in 2002 which increased to almost 4 hours in the final year. Going to pubs and discos, watching TV and shopping all showed an increase in the number of hours teenagers spent on these activities. Both going to pubs and discos, and shopping more than doubled in hours from over 5 to over 15 and from over 5 to exactly 15 respectively. The number of teenagers dedicated to watching DVD’s was only 10 hours in first and final years, but reached a peak of over 15 hours in 2004 and 2005.
The other pursuits showed a decrease in hours, except watching DVD’s which fluctuated. While teenagers occupied 10 hours doing homework in 2002, this figure dropped to just over 5 in 2007. Playing sport fell more dramatically from 10 hours to around 3 hours. Bowling was around 5 hours throughout the entire period declining by about 4 hours in total.
D
CAI
BFEJH
G
D-C-A-I-B-F-E-J-H-G
The bar chart illustrates how many hours adolescents in chester spend on seven activities each week between 2002 and 2007.
Teenagers spent 25 hours on watching television in 2002 which increased to almost 40 hours in the final year. While teenagers occupied 10 hours doing homework in 2002, this figure dropped to just over 5 in 2007.
The other pursuits showed a decreased in hours except watching DVD’s which fluctuated. The number of hours teenagers dedicated to watching DVD’s was only 10hours in first and final years , but reached a peak of over 15 hours in 2004 and 2005.
Going to pubs and discos, watching TV and shopping all showed an increased in the number of hours teenagers spent on these activities. Playing sports feel more dramatically from 10hours to around 3 hours.
Overall, the most popular activity over the period given was watching TV, whereas bowling was the least favourite.
D,G,A,C,I,E,H,J and F
D,G,A,C,F,I,B,E, and J
D C I A F H B E J G
D,C,E,F,J,H,G
D,C,B,I,A,E,J,F,H,G
introduction:D
Overview:GCB
Body para 1:AE(using linking words )
body para2:IBJ(using linking words), then JH as final sentence.
organisation:DGCBAEIBJJH
The bar chart illustrates how many hours adolescents in chester spent on seven activities each week between 2002 and 2007 .
Overall , the most popular activity over the period given was watching TV , whereas bowling was the least favourite .
Going to pubs and discos , watching TV and shopping all showed an increase in the number of hours teenagers spent on these activities . Teenagers pent 25 hours on watching TV in 2002 which increased to almost 40 hours in the final year . Both going to pubs and discos ,and hopping more than doubled in hours from over 5 to over 15 and from 5 to exactly 15 respectively . The number of hours teenagers dedicated to watching DVDs was only 10 hours in first and finally years , but reached apes of over 5 hours in 2004 and 2005 .
The other pursuits showed a decrease in hours , except watching DVDs which fluctuated .While teenagers occupied 10 hours doing Homework in 2002 , this figure dropped to just over 5 in 2007 . Bowling was under 5 hours throughout the entire period declining by about 4 hours in total . Playing sport fell more dramatically from 10 hours to around 3 hours .
D,C,B,I,A,J,E,F,H,G
D,G,E,F,A,H,I,J
A) 2007
B) year 2007
C) 73 hours
D)watching TV in 2007
E) yes
F) yes
G) 2007
H) year 2002
I) from2002 to 2007
J) from2002 to 2007
D G C I B F E J A H. Thank u Liz for this exercise on task 1. Expecting the model answer tmrw
D, C, A, I, B, J, H, E, F, G
D,C,B,A,I,E,J,H,F,G