Below is an IELTS table model answer for writing task 1. The IELTS table below is taken from IELTS Cambridge book 7. The sample answer is estimated at band score 9. This page was last up-dated 2019.
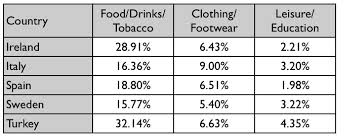
The table below gives information about consumer spending on different items in five different countries in 2002.
Source: IELTS Cambridge English Test Book 7
IELTS Table Model Answer
The table illustrates the proportion of national expenditure in Ireland, Italy, Spain, Sweden and Turkey on three types of consumer items in 2002.
Overall, the category of consumer goods that all countries spent most on was food, drinks and tobacco, which was three times higher than on the other types of goods. The lowest spending could be seen in the category of leisure and education in all five countries. The outlay of Turkey was generally higher than the other four countries.
In terms of food, drinks and tobacco, Turkey spent the most at 32.14%. The expenditure of Ireland was also high (28.91%) compared to Sweden which spent the least (15.77%). Spain and Italy spent 18.80% and 16.36% respectively. On the other hand, the lowest expenditure was on leisure and education which accounted for under 5% in all countries. Turkey spent most on these items at just 4.35% of their national expenditure which is around double that of Spain (1.98%).
Clothing and footwear was the third category of consumer goods and outlays for those items were between 9% in Italy and 5.40% in Sweden. The national spending in this area for the remaining countries averaged around 6.5%.
Tips for IELTS Tables
- Put all your key features in the overview. Note one key feature is not enough for a high score.
- Divide your body into paragraphs.
- You don’t have to give all details. You can group details together by giving averages or ranges.
- Be selective. Don’t put too many details in your report.
- Make sure you write over 150 words but aim for less than 200.
- Use a range of linking devices eg compared to / as opposed to / in terms of / while etc
- Try to avoid being repetitive with your sentence structures.
- Some words will be repeated. There is always a limit to how many synonyms one word has. As long as you show the skill or paraphrasing and avoid errors, it’s fine.
Other Writing Task 1 Models
- Bar Chart Model
- Line Graph Model
- Pie Chart Model
- Map Model
- All Writing Task 1 Tips and Model Answers
Main IELTS Pages
Develop your IELTS skills with tips, model answers, lessons, free videos and more.
- IELTS Listening
- IELTS Reading
- IELTS Writing Task 1
- IELTS Writing Task 2
- IELTS Speaking
- Vocabulary for IELTS
- IELTS Test Information (FAQ)
- Home Page: IELTS Liz


Thank you sooooooooo much ♥️ for sharing this task and tips. I’m really glad to get these.
I am Ruhi, from Bangladesh
If pie chart is given along with the table, then, do we have to write over view from both or from pie chart only?
The overview is for everything on the paper. If you have two charts, or one chart and one table, it all goes in the overview together.
Hi Liz,
Can I use bracket to mention percentages?
Thank you
You can use brackets in Writing Task 1. However, be flexible with how you present information and don’t overuse them.
Thank you for all the good work Liz, this indeed has been very helpul for me.
I’m glad it’s useful 🙂
The table shows the proportion of consumer expenses in three categories in five countries in 2002. Looking from the overall perspective, it is readily apparent that the category of food, drinks, and tobacco was the most popular, and it was followed by clothing and footwear. In contrast, people spent the least expenditure on leisure and education.
Among the five countries, Ireland and Turkey recorded the highest percentages in food, drinks, and tobacco section, at 28.91% and 32.14%, respectively. The proportion of expenditure of Turkish people was also the highest in leisure and education, at 4.35%. For the clothing and footwear category, a significant percentage of 9% of Italian people were consumers.
However, it can be seen that Sweden had the lowest percentages for food/drinks/tobacco and clothing/footwear sections, at just under 16% for the former and 5.40% for the latter. Meanwhile, the percentage of expenditure on leisure and education of Spanish consumers was just around 2%.
Hi!
Thanks for all the website, it’s REALLY awesome and indeed assists me with preparation for IELTS.
Maybe, you could help me out, for I’m a bit perplexed. In the sentence “A similar pattern could be observed for Turkey, who/which spent the highest percentage…” should “who” or “which” be used. Since, generally, they use “which” with countries and “who” when talking about people. In this situation, the sentence is about people who spend, although it is expressed by country. So what is the correct option to use?
Thanks in advance)
“Turkey” is not people, it is a country so you need “which”.
Hello liz.
I took the IELTS indicator last week. everything went like I planed before, however, in the writing section task 1, I was given a line chart. They only put 2 lines in this line chart and both were increasing. I did not have much to write because they were not a lot of information. Which cause me to have 5 in writing. I’m taking the exam again and I am really scared that they would give me the same one . What can I do….
Do you want to recreate the line graph you got so I can write a model answer?
Hello Liz!
Thank you for your valued material. I just have a question for you, referring to tables (or probably it applies to other types of charts). When we are given groups, such as age groups or food groups, that implies different variables in the same category, can I change it by numbers? For example, Instead of saying “food/drinks and tobacco, can I use the expression: first group? or the second group (clothing, footwear), depending on the place in the table?
Thank you! 🙂
You would only be able to refer to them that way if you had introduced them in order in the introduction paragraph. Even then, you should alternate your expressions.
Perfect!
Thank you for your help! 🙂
Hi Liz,
I can not thank you enough. Thank you so much for your help
By the way, I have one question.
Why is it “consumer items?” I thought it was consumed items.
“consumed” means either used or eaten. “Consumer” is a customer who buys products. Go to a dictionary and take a look for more precise definitions.
Perfect. Thanks a lot!
Hi Liz! I am doing the IELTS general test, do I need to practice table and chart exercises on the writing tasks?
Or does it come up only in the academic version of the test?
Thank you
Can you see the RED MENU BAR at the top of the website? Go to “TEST INFO” and select “GT” from the drop down list. That page will explain it all for you. There are loads of pages of tips, lessons, advice, information on this site. Use the RED BAR to open the main pages which will give you access to the lessons etc.
Hi Liz
Loved this answer. I have a doubt if we write the overview as 2 nd para will that be counted as a summing up/conclusion. I heard that conclusion has extra points for writing. Please help.
Thanks Sandra
The conclusion is essential for writing task 2. If you fail to write a conclusion for writing task 2, you will get a lower score for Task Response. Writing task 1 is not an essay, it is a report. An overview is required for task 1. It is more logical to give the key features before the smaller details in a report.
Hi Liz!I really appreciate the organisation of this task it is clear and coherent.But one thing that confuses me ,why did you describe Sweden at your 2 body ,i mean sweden’s data is not highest 🤔
You task is not only to present the highest. It is to highlight key features and that includes the lowest. In body paragraph 1, Sweden was the lowest. In body paragraph 2, Sweden was the lowest.
Hi Liz, I really appreciate for your amazing posts. It helps me A LOT!!!!
By the way, I have a question, Some of the answers separate the overview paragraph and some don’t.
Is either way correct?
Both ways are correct. I tend to put my overview in the same paragraph as the introduction for diagrams if the introduction is only a few words in length. Otherwise I keep it entirely separate.
This report was just great! I really liked how the information was grouped and delivered.
However, I have one question with respect to the report on this topic I wrote myself trying to make use of paragraphs in order to group the similarities.
Can I use ” ” to refer to a certain category? (e.g. in terms of “foods, drinks and tobacco” and “leisure and education”, the Turkish spent the most on these.)
No, it is best not to use “”.
Dear Liz,
Your contents regarding IELTS are really usefull and important. But I’ve a little doubt. You’ve recommended to use 2 paragraphs for the body and other 2 for the introduction and overview.
But my IELTS teacher taught me to use 3 paras(for body) for the 3 columns in the table.
And 3 paras(for body) if there are 3 pie charts in the task.
And 3 paras(for body) if it is a line graph. (1 for starting year, 1 for ending year, 1 for the rest of the duration)
Could you please explain whether it is correct or wrong !
Paragraphing needs to be logical and that is certainly logical. But it also needs to be used to group information together and highlight similarities – your paragraph is more than just 3 charts = 3 body paragraphs. Start looking more at the information being presented and see if you can find trends or features that can be grouped together making paragraphing more effective rather than simplistic and obvious. Your teachers recommendation limits your score in Coherence and Cohesion – not a problem is you are not aiming for a high score.
Dear Liz,
ı really can’t find the words to tell you how grateful I am of your content. After taking the exam for the 5th time, ı finally managed to get a 7,5. my previous score was 7, by reading the model essays and suggestions ı got the sore that ı needed. thank you sooo sooo much. ı really don’t think that ı could have done this without your help. ı wish you an amazing life, my you be happy just like you make others happy.
Well done getting the score you needed 🙂 I’m so pleased my lessons were useful for you 🙂
Hello, Liz, I saw you just wrote “on the other hand” without mentioning “on the one hand” before, is that proper?
Thanks for replying.
Sure. No problem. You can use “on the other hand” without using “on the one hand” – but not vice versa.
hi Liz
i m extremely thankful to you for your guidance.
In the above example essay for table, the discussion about expenditure on clothing and footwear category is only about highest and lowest nation.
Isn’t there a chance that the essay may marked down for the task achievement metric????
Also for the education and leisure also the averaged percentage are used to represent the intermediate countries, so can we proceed in that manner without violating the task achievement rubric???
That is incorrect. The paragraph about clothing and footwear contained information about all categories. You forget to look at the final sentence of that paragraph: “The national spending in this area for the remaining countries averaged around 6.5%………..”. This is called grouping information together and is a vital skill for writing task 1.
Hello Liz,
Finding very easy to describe the table chart thanks for your help. I have a question ‘Is there any way we add end note at last? Like overall table show the European consumer expenditure.
Be very careful of adding another statement which presents overall information. If you do that, it would mean that you have split the overview into two separate statements which exist, not together in one paragraph, but split into different parts of the report. This will lower your score for Coherence and Cohesion which is about logical organisation of information and paragraphs. Do you see what I mean?
Hi Liz, I noticed the tense you used in your text is past tense, is this due to as the statement says 2012? What if the there is no specific dates given then present tense would be the appropriate tense to use correct? I have seen other teachers use present tense regardless of the year. Please advise.
Kind regards,
Ahmed
Never ignore the dates given.
Hi Liz. I really love your video. I want to ask you why my Australian teacher said I will lose score if I use “ illustrate” in task 1 except for diagrams. I learn how to write task 1 from your video and what he said today made me confused.
The word is fine to use. That is completely untrue.
Hi just wondering can i use ‘ The pie chart provided above gives information about….:is that correct in the report speech?
Or that must to be only ‘ The pie chart illustrates the information/data….
You have written “above” what is above the answer sheet? Nothing. You can’t use that word. Otherwise, it is fine.
Hi Liz, I really like your website, you are doing amazing work.
Can I start to overview with ‘to sum up’ instead of overall? Besides, is there any problem with writing an overview in the last paragraph?
Thanks
The examiner is specifically looking for an overview. It is the most important paragraph. Which linking device do you think is most suitable?
Thanks for the writing can you give us to the digram explains and maps?
Go to the main writing task 1 page for all my model answers – click on the RED BAR at the top of the website.
Thanks a lot ma’am. India has a lot of respect for you
Can food drinks and tobacco written as consumption, footwear and clothing as fashion and leisure and education as luxury and studies?
Do not change the titles – they are specific to the information given.
Plz upload more table chart sample answers like this . Only one chart can not represent all things.moreover plz describe the structure of table chart, where we write what value , where what
HURRY UP!
MRS . LIZ MAM
Did you click on the RED BAR at the top of the website to see all my writing task 1 lessons, tips and model answers?????? Please do so now.
Is it possible to bring a calculator in the exam, I don’t think I’m this good at quick maths. :/
You do not need to know any maths at all. There are no calculation needed. No, you can’t use a calculator – there is actually no need for one.
thanks liz i ve benefited alot of ur model answers , i appreciate ur work and effort 🙂
Hi Liz, Some IELTS teachers suggest that I can not use bracket + numbers. For example, the expenditure of Ireland was also high (28.91%). Other IELTS teachers suggest I must write, the expenditure of Ireland was also high, with 28.91%.
Please check if these two ways are correct. thanks.
It is fine to use brackets but not all the time. You need to show flexibility with language as well.
Hi Liz,
Sorry if it’s already mentioned somewhere, but if I use given category like “Food/Drinks?Tabacco”, does they count it as one word or 3 words?
You need to write with correct grammar. “Food/Drink” is not correct grammar. Write everything in full.
That’s really helpful, thank you!
You didn’t answer his question, which would make for a very low task response score 😛
So, would “Food/Drink/Tobacco” count as 1 word or 3 words?
Thanks
As I said, you can’t write it that way at all – it is grammatically incorrect. It would count as a grammar mistake and all mistakes will eventually lower your score. You need to write it in full: “food, drink and tobacco” and those are 4 words. All headings and categories need to be adapted to make them grammatically correct – that includes correct use of capital letters. Hope that helps 🙂
Hi Liz! It is good of you to have such a site that the most English speakers need. Thank you very much. I would like to know can I post my essays here or write directly you. I would be gratefull if you could check and give your advices. Is it free if you check my essays or for payment? You can write me for details.
Sorry I don’t offer a marking service.
Hi Liz,
“The expenditure of Turkey overall was higher than the other countries.”
Is it correct if I write in following ways? I am struggling with grammars of comparison.
1. The expenditure of Turkey overall was higher than that of the other countries.
2. The expenditure of Turkey overall was higher than that of other countries.
3. Turkey spent more than the other countries.
Thank you,
Shirley
You can write “The overall expenditure of Turkey …”. Otherwise, fine.
Hi Liz,
The expenditure of Turkey overall was the highest of all other countries.
Or
The expenditure of Turkey overall was higher than the other countries.
Which one is correct?
As Turkey is compared to more than two countries, is it okay to use comparative degree instead of superlative?
Both are fine. One is a comparative and one a superlative. You decide which grammar features you want to use.
Can i replace respectively with accordingly?
No.
The table represents distinct costumer products spend by five different nations in the year 2002.
Overall,most of the expenditure is made on food,drink, and tobacco while ,least amounts are spend on leisure and education.
Turkey has spent highest amount on food,drink and tobacco followed by Ireland citizen by 28.91%. Moreover, the expenditure of Sweden is less than other 5 countries.In clothing and footwear Ireland, Spain and Turkey have almost same expenditure ratio around at 6% where as,Sweden spend only 5.40% that others.Regards to education and leisure people of Turkey spend 4.35% which is highest than others whilst, only small proportion is made by Spain ,just only 1.98%.
In contrary, Sweden and Italy have spend approximately at ratio on education and leisure as only 5.49% is accounted on clothing by Sweden than that of Italy.
Dear, liz plz give feedback on this essay as I am not sure where I did my mistake on
Thank you
Sorry I don’t give feedback on writing.
Sir you are a extraordinsry teacher but like my mom so some times i think that while reading your uplosded artical or anything which is relsted ielts my mom is teaching me i feel fantacy
Indeed, english is a funny lanagauge.
Hi Liz,
My test is about 7 days ahead. Please evaluate my answer, correct and advice me.
“The given table clarifies the spending amount of consumers on variety of consumables in (Ireland, Italy, Spain. Sweden and Turkey) in 2002.
Overall, The highest used type of consumables in all mentioned countries were food, drink and tobacco. On the other hand, the lowest consumed items were leisure and education.
Turkey led the table in consuming food, drink and tobacco with 32.14%, while Ireland came second with 28.91% and then Spain, Italy and Sweden followed in sequence with 18.80%, 16.36% and 15.77% respectively.
The Spanish people spent only 1.98% on leisure and education as the lowest expenditure of all mentioned countries compared to the Turks whom spent 4.35% while Ireland was the second lowest by 2.21% and Italy had 0.2% less than Sweden which paid 3.22%. At the time, clothing and footwear witnessed very close range between all countries except for Italians whom distinguished by 2.27% above their closest rivals the Turks”.
152 words 🙂
Not so good beta..
As what Liz or someone has mentioned in the above task, do not get everything from the table to your writting. Too much details doen’t work all the time you know?
Thank you so much. This website is very useful and I appreciate it.
Hi, Liz, I was explained that we cannot use one word more than twice but in this writing 1 the word “expenditure” is used 7 times. Is it ok?
Of course you can use one word more than twice. Who told you this? It is false information. Yes, you need to show the skill of paraphrasing but you can repeat words. In fact some words in English can’t successfully be paraphrased and will need to be repeated.
Hi,Liz!
I thought that we were supposed to write 2 body paragraphs (body para A and body para B).However,this model answer has 3 body paragraphs.So,is it okay to write more than 2 (not more than 3,though)? Just wanted to make sure it’s fine! Thank you!
You can choose either two body paragraphs or three. Your choice will depend on the type of essay and on your ideas.
I was talking about Task 1 🙂
Sorry. For task 1 , about 80% of all task 1 will require only two body paragraphs. Just occasionally you will have three, it depends on the information given in the chart, diagram etc. The body paragraphs in task 1 are not equal length. This is different in task 2 where body paragraphs are equally developed,
Thank you so much for your answer!
Highly valued advice. Many thanks, Liz
I really appropriate your efforts
You’re so kind. Thanks for the free lessons. I’m preparing for IELTS test as well. Your website is really helpful.
You’re welcome 🙂 All main pages are on the red bar at the top of the page. See my writing task 1 main page: https://ieltsliz.com/ielts-writing-task-1-lessons-and-tips/
Hi Liz,
some people mentioned that in overall part we should not write dates,numbers or percentage,how far true is that in your opinion or just a false rumor
THANKS
CAPRI
There is no right or wrong. I usually present my data in body paragraphs. But if you have totals, such as in a table, you must put them in your overview. Teachers each have different techniques.
Respected Madam,
I have confusion where it is mentioned ” Write no more than three word and/or a number”
Please watch the video on this page: https://ieltsliz.com/ielts-listening/
Hello teacher.
My introduction paragraph is right.
I’m waiting for your reply.
The provided table elucidates,the proportion of expenditures of five unsimilar nation on different items in 2002.In this aspect,there was three different categories of items.However,the highest ratio showen by Turkey while lowest proportion shown by Sweden throughout the whole year.
We don’t use the word “elucidates” in task 1.
For example: I have two tables one of them named by beer consumption and the another one named by juice consumption and each table contains 10 different countries.
My key features are:
Table one:
Ireland has the highest amount of beer consumption
Finland has the lowest amount of beer consumption
Table two:
Canada has the highest amount of juice consumption
Newzealand has the lowest amount of juice consumption
My overview:
Both Ireland and Canada have the highest amount of beer and juice respectively compare to Finland and Newzealnd.
Hi Liz,
I have question
if in task 1 gave us 2 different charts
what should we do in this?
You introduce both in your introduction. Put the key features for both in your overview. And then have one body paragraph for each. This is not a fixed rule but a general rule and can be adapted.
Hlw Liz
Thanks for your lesson 😊
Can I use bracket like this on Table:
Kyoto has the smallest underground railway system (only 11 kilometers of route) which is more than 30 times less than that of London.
TIA
Yes, it’s fine to use brackets in writing task 1.
Was there a conclusion or it is not needed
Please see this page: https://ieltsliz.com/ielts-tips-conclusion-or-overview-for-writing-task-1/ and then read more about task 1 on this page:https://ieltsliz.com/ielts-writing-task-1-lessons-and-tips/
is it necessary to write percentages in brackets?
You can use brackets or not – it’s your choice.
Hello! I am finding difficulty in table part can u make up a video for that
I hope to make more videos next year.
Is it compulsory to leave a line after one paragraph?
No, it isn’t compulsory. It is only recommended because it makes it easier for the examiner to see your paragraphs.
Do we need to write a conclusion in writing task 1?
You can find your answer on this page: https://ieltsliz.com/ielts-writing-task-1-lessons-and-tips/
Is it counted that you repeated main ideas ? because in paragraph2 you mentioned the lowest expenditure and in the last paragraph too ??
Giving details in the body is not the same as repeating. In the overview, you highlight and in the body you give the details, which means the figures or the data.
Could somebody check my work?
The given table illustrates and describes the total percentage of consumed items by Irish, Italians, Spanish, Swedish and Turkish on food, drinks, tobacco, clothing, footwear,
leisure and education. Overall, it is clear that the most well-consumed items from five
nationalities were foods, drinks, and tobaccos, whereas, the least tolerated items was in
leisure and education. It is also evident that Turkish spent more money on different items than other nationalities.
In detail, in terms of foods, drinks, and tobaccos, Turkish was the one who spent most of their money on this item, with about a third (32.14%) of the total percentage. Second to them was Irish with more than a quarter (28.91%), while the others had, less than a fifth (18.80%) for Spanish, and a sixth for both Swedish and Italians (15.77% and 16.36%, respectively).
On the other hand, clothing and footwear were considered as the second most consumed items in five countries. Italian accounted for the highest spender on this item with about less than 10% of the total money spent,opposed to Swedish who only spent less than 6%. While other nationalities such as Turkish, Spanish and Irish spent about less than 7% on this item.
The least among the items were leisure and education, it is clear that all five countries allocated only a small fraction for this item. About less than 5% for all nationalities. The highest spender was Turkish while Spanish was the lowest spender.
Aim to write about 170 words in task 1.
Hi liz…thanks for your this very helpful content…
hi liz ma’m..pls can u go through it if u hav time…
The table illustrates the data of expenditure (measured in %) of five nations (Ireland,Italy, Spain, Sweden and Turkey) in three different categories, in the year 2002.
Overall, all of the given countries spent the most for food, drinks and tobacco, whereas they spent the least on leisure and education. Expenditure of Turkey was comparably higher than the other countries.
Regarding the food, drinks and tobacco, Turkey spent a significant portion (32.14%) when compared to that of Ireland (28.91%), which stood well ahead of Spain (18.8%).Expenses of Italy and Sweden were figured out as 16.36% and 15.77% respectively.
On examining the next category of clothing and footwear, Italy held the top position with 9% and Sweden (5.4%) at the second position, while Ireland, Spain, and Turkey averaged around 6.5%.
All the countries spent a very meagre amount for leisure and education. Turkey spent 4.35% of their national expenditure on this category, which was roughly double the amount that of Spain (1.93%). Italy and Sweden together accounted for an average of 3.2%, while Ireland spent 2.2%.
Sorry I don’t comment on writing.
Hi, Liz
First of all, I must thank you for the useful information on ielts.
I feel like falling in love with English now, thanks to your clear and kind lectures.
Here is the question about this model essay.
In this essay, it says ‘Turkey spent most on’ but, I assume that it only makes sense when all the percentages of others are shown on the table which can be added to 100% including the data given.
To say a country spent “most” does not indicate a percentage of a whole. It only indicates which is higher than others.
can i give numbers in my overview?
Yes, if the numbers are totals given in a chart or table.
Dear liz,
please help me to clarify the following doubt.is it possible to use subsequently instead of respectively
thank you
Hello Miss,
Should we write it as a divided writing , i mean with leaving lines or write it without leaving lines in between?
Write the same as my model. Just leave one line between paragraphs.
hi liz, the table sample above is very awesome but something confused me . for example, you use the words: “spent” and “expenditure” many times in the same paragraphs.. it seem to be repeated, and we must have the range of vocabulary. can you explain for me? tks liz, the role of your all lessons in this web is very useful and important for me!
https://ieltsliz.com/liz-notice-2015-2016/
Dear Liz
It would be very kind of you if you could score this sample for the table.
The table compares the percentage of money spent on various items in five nations in the year 2002.
As can be seen, the most popular item of purchase was food/drink/tobacco in all the five countries, followed by clothing and leisure/education.
As regards food/drink/tobacco, the highest proportion of expenditure belonged to Turkey (32.14%). With an almost 3% different, Ireland stood in the second place at 26.91%. Sweden and Italy accounted for around half the corresponding figure for Turkey, except Spain at 18.80%.
Totally, clothing and footwear were bought approximately 3-4 times less than the items in the first category. The leading country, Italy, for example, spent just above half that it spent on food (9%). Ireland, Turkey and Spain allocated nearly similar budget to clothing as opposed to Sweden bring at the bottom of the list, at 5.40%.
When it comes to education, the figures dropped even more. While Turkey became top again at 4.35%, Ireland spent about two times less. Italy and Sweden had very identical proportions, at 3.20% and 3.22%, respectively. It was Spain (1.98%) where the least amount of money was spent on leisure.
Hi Liz,
can we add one line in first paragraph, e.g it is calibrated in percentage or units are measured in percentage.Please tell me as early as possible because I have my exam.
Thanks & Regards
https://ieltsliz.com/liz-notice-2015-2016/
You wrote “all contries spent MOST on food, drink and tobacco” and “Turkey spent THE MOST at 32.14%”. Why in the second sentence, did you use THE?
https://ieltsliz.com/liz-notice-2015-2016/
In the last paragraph you wrote (…..Spain who spent ..etc ) is it correct to write Spain which spent and would you explain to me the different
and i want to say that your efforts helps us alot..thanx liz☺
Thanks. Well spotted!
Where in Vietnam are you teaching at?
Can you give me a piece of advice to improve the thinking strategy, to make the writing more logical, sharp on every point and still interesting?
Thank you so much😊
https://ieltsliz.com/liz-notice-2015-2016/
If our word length complete but don’t write overall then what is penalty for this?
Look for your answer on this page: https://ieltsliz.com/ielts-writing-task-1-band-scores/
All the best
Liz
Thnx mam,
Nd plz tell me how writing score calculated
See the band score information on this page for task 2: https://ieltsliz.com/ielts-writing-task-2/ and this page for task 1: https://ieltsliz.com/ielts-writing-task-1-lessons-and-tips/
All the best
Liz
Hi,
I have watched all the videos for IELTS task 1 and am a bit confused. In the video you mentioned that there should be a total of four paragraphs including the overview but in the sample essay above there are five paragraphs. I noticed a similar pattern for a question where three pie charts were given.
Please explain when it possible to write five paragraphs and why.
I also mentioned that sometimes it is possible to have three body paragraphs instead of two. This is the same as task 2.
All the best
Liz
Hello Liz,
I wrote an essay on the given table,can you please tell me that how many bands will my essay get?
Here’s the answer
The table illustrate about the fluctuating percentage for the national consumer expenditure on food/drinks/tobacco,clothing/foot wear and leisure/education in different countries which are named as:Ireland,Italy,Spain,sweden and Turkey in 2002.
As it can be seen that first category is for food,drink and tobacco,so if we compare Turkey with other countries,there’s a huge difference between percentages which is approximately 32% in Turkey whereas in Ireland its about 30%,slightly less than Turkey.While Spain expand 16%only.
If we look on clothing and footwear category,Italy Surpassed from all countries and its percentage is exactly 9%. Whereas Ireland,Spain and Turkey expand approximately 6% while Sweden expenditure were only 5%.
In the third and last category which is of leisure and education,by which it can be seen that Turkey is now again on the top of the list and attain 4% of expenditure while Italy and Sweden expand approximately 3% only. Whereas Ireland and Spain expenditure were only 2%.
Overall,consumer from all countries expand mostly on food,drinks and tobacco while expand less on other thing.
Sorry I don’t give feedback on writing.
Liz
How many paragraphs should be there for writing task 1 Liz ..Is 3 paragraphs sufficient ?
Go to the main writing task 1 page and watch the structure and paragraphs lessons.
Liz
Mam pls tell me that should overview write in the end or after intro.
See this lesson: https://ieltsliz.com/writing-task-1-report-structure/
Liz
Thanks mam
Please don’t call me “mam”. I am not your mother. Just call me Liz.
Thanks
Liz
Thanks mam
But my mam told me that put it at the end not after the introduction. Now I m confused. Pls suggest me.
You can put it with the introduction, after the introduction or at the end. The most usual place is after the introduction because it contains the key information about the chart which is more logical to read before the detail.
All the best
Liz
Sorry liz for calling mam.
thanks a lot.
Hi, i want to know that in Task 1 ,Is it important to write overall in 2nd paragraph or we can also write in Last ?????
See the lesson on structure and paragraphs on the writing task 1 page.
All the best
Liz
Hello, I want to know that if we can write the data in brackets.For example, Turkey(28.5%),……..high(50%).
Yes, it is normal to use brackets in writing task 1.
Liz
Hello Liz
Fist of all i would say thank you for all the effort you are making to help people who intent to take Ielts. Can you please post more information regarding to table task 1 because i find it one of the mos difficult among the other types of tasks.
thank you
Yes. Thanks for reminding me. I really must do that soon.
All the best
Liz
Hello Liz
some tables has very long phrase to illustrate the measure of the data. For example “Average Distance in miles traveled per person per year”. So, each time I write number, It should be followed by (miles per person per year). and that’s quite annoying… My question is : Can I write symbols instead of phrases , for example (M.P.Y) instead of (Miles per Person per Year). ِand I will demonstrate that this symbol stands for that phrase in the first time I use it.
Regards
You introduce that information in the introduction and then you don’t need to repeat it.
Liz
but I have to repeat that in body paragraph.. for example, I want to say that ” In 1989, the most popular mod of travelling was cars, which was 3199 (miles per person per year)”.. and the same for other numbers..
I hope that my further question would not bother you.
As I can’t see the table, I can’t give you the sample sentence. If you are refering to miles, then you don’t need to repeat that it is per person, per year.
Liz
OK. Thank you Liz
Hi Liz
could you help me to write the best answer for the following Task 1 question (table model) because it misguides me due to the absence of any numbers or rates or % please ?
Q/ The table below represents the opinions of tow groups in regards to the main causes of air pollution
group 1 group2
manufactures pesticides & plant fertilizers
cars manufactures
pesticides & plant fertilizers household wastes
household wastes cars
with my kind regards
This is not an authentic IELTS table. You need to find the original.
Liz
Sorry for the disturbance in printing, the question was in IELTS exam in 31/01/2015 in Exeter college center. even though I have written depending on my memory, but it was with the same idea and same issue. as I told you there was no rates, no numbers and no % .
group 1
manufactures
cars
pesticides & growth fertilizers
household waste
group 2
pesticide & plant fertilizers
manufactures
cars
household waste
these 2 groups of pollution causes (according to people opinions) were put in one table I think according to the priority
Regards
The key is that they were according to priority. That means that the first one is number 1 priority, the second is number 2 priority etc for each table. This means it was ordered by priority number. You need to state what the two groups represented – age groups, income groups? you can see that the main priority in the first group is manufactures while in the second group it is pesticides and plant fertilizers. The lowest priority was household waste for both groups. To be honest, unless I saw every single word with full instructions, I can’t offer you more information.
Liz
To be honest, I have been endeavoring to find such design of question in different books for a long time but without result. I think it is more profitable and I will be grateful if you design and post such question with the fitted answer.
Thanks a bundle with my regards
I also have never seen such a table. Can you remember what the two groups were for this table? I’ll try to replicate it.
Liz
which was almost three times that of the other items. ( I didn’t understand this sentence . plz will you explain )
It means three time more.
Liz
Hi Liz,
I found your blog very useful for my IELTS writing improvement. Currently, I have one sentence which I doubt using:
“Overall, it can be seen that all three aiports saw an upward trend with some variations among one and another.”
Could you please advise me on whether the phrase “among one and another” above is correct?
Many thanks in advance.
Christian
You shouldn’t be writing “some variations among one and another” because all lines have variations so it is irrelevant to put such information in your overview.
All the best
Liz
Thank you very much for your comment Liz! ☺
Hi, i am a student.
Excuse me, is it not better to write instead of ”Turkey has….”, I write “Turkey had…” ?because it was in 2002?( past simple), please tell me if i am wrong, thank you.
If the dates in the past, you must use past tense.
Liz
Hi ,
can i paraphrase the word “spend” with words like “consume” , “expend” , “use” and “drain”
because “spend ” is too much repeated !
Thanks !!
Regards,
The meaning of the verb depends on the noun with it. Consume fuel means to use fuel. Consume food means to eat food. You need to look at each context carefully.
Liz
okay .. Thanks 🙂
Dear Liz,
can you explain why “most’ is used in this sentence “all countries spent most on..” while ” the most” is used in this sentence “Turkey spent the most”?. I am really confused with this case.
Thank you so much, Liz
It’s just a variation. It’s best to use “the” though.
Liz
Hi Liz,
Is there any other word that I can use to paraphrase “proportion”?
Thanks
Regards,
Jennette
You could use “percentage” or in some cases “rate”.
Liz
Hello, I saw that you used the word ‘expenditure’ more than five times. Is it correct in IELTS exam?
Yes, you can’t change words all the time. English has a limited number of paraphrases for any word. The word “expenditure” can only be paraphrased as “money spent” or “spending” – so of course, words will be repeated.
Liz