This model line graph for IELTS is estimated at band score 9. The model answer below is for IELTS writing task 1 academic paper. Use this sample writing as a template for structure, key features and language for any IELTS line graph. There are also some tips given below to guide you and help you understand how to describe this type of graph.
IELTS Line Graph Sample Task
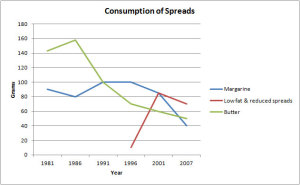
The graph below shows the consumption of 3 spreads from 1981 to 2007.
Source: Graph above not created by IELTS Liz. Source unknown.
IELTS Line Graph Answer
The line graph illustrates the amount of three kinds of spreads (margarine, low fat and reduced spreads and butter) which were consumed over 26 years from 1981 to 2007. Units are measured in grams.
Overall, the consumption of margarine and butter decreased over the period given, while for low fat and reduced spreads, it rose. At the start of the period, butter was the most popular spread, which was replaced by margarine from 1991 to 2001, and following that low fat and reduced spreads became the most widely used spread in the final years.
With regards to the amount of butter used, it began at around 140 grams and then peaked at 160 grams in 1986 before falling dramatically to about 50 grams in the last year. Likewise, approximately 90 grams of margarine was eaten in the first year after which the figure fluctuated slightly and dropped to a low of 40 grams in 2007.
On the other hand, the consumption of low fats and reduced spreads only started in 1996 at about 10 grams. This figure, which reached a high of just over 80 grams 5 years later, fell slightly in the final years to approximately 70 grams in 2007.

Tips for Line Graphs
- Paraphrase the line graph information for your introduction.
- Put main trends and any other key features in an overall statement.
- Make sure each body paragraph sentence has numbers and dates to support it.
- Check the video lesson below to learn how to write a complex sentence for an IELTS line graph report.
- Practice!! Click here: Practice Line Graphs to get a selection of sample line graphs to practice writing for your writing task 1 preparation.
Recommended Tutorials
- Bar Chart Model: Band Score 9
- Line Graph Vocabulary
- The 4 main complex sentences for a line graph: Video Tutorial
- All writing task 1 lessons and tips
……………………………………..

………………………………
Subscribe to get New Posts by Email


Hi Liz,
thank you for all the good work you are doing and the amount and quality of material you provide. 🙂 Just a quick question, although it may have been answered before. I’m taking a computer-based test and I was wondering about the structure of the paragraphs in the written tasks. I know that there should not be any gaps in the beginning of the paragraphs or on the left side of the text, but what about the right side? Should I choose it to be the same or do you think this will affect in any way the presentation of my essay? Thank you in advance :))
As you see, I write my model answers on a laptop. Follow the way I present paragraphs 🙂
The consumption in grams of three different spreads namely: margarine, low fat and reduced spreads, and butter for 26 years is illustrated in the line graph.
Although the utilization of the spread, specifically the butter was greatly used from 1981 to 1900 reaching up to nearly 160 grams, its consumption never been the same after 1990. The consumptions since after the said year have continuously dropped until 2007. Similarly, the used of low fat and reduces spreads hiked up in the year 2001 reaching just over 80 grams and slightly yet consistently decreased over time.
On the other hand, the utilization of margarine has a different trend, it started with over 95 grams in the starting years then had a slight decreased by 1986, then it gradually increases up to 100 grams and stayed with same measure over 6 years from 1991 until 1996, from that year little by little the consumption rate dropped to 40 grams in the year 2007.
Hi Liz
I want to ask that if we start our introduction writing ‘a glance at the line graph or given is line graph illustrating smth’ , does it bring higher score? What about using inversion in overview, body part? Thanks in advance
No, it doesn’t help your score at all. Using “AT a glance” is actually completely inappropriate considering you are supposed to analyse and not glance at the chart. Just stick to the standard language for report writing. Task 1 is formulaic and can be easily learned.
Does the overview have to start with ‘Overall’ ?
The examiner is looking for appropriate and logical linking words – this is the most logical and most appropriate way to start an overview. Why would you not want to use it?
I had gone through many ieltes coaching websites but yours is the best .I am starting to learn using this.Thank u so much
I’m glad my site is helping you 🙂
Dear Liz,I am your big fan
Your explanation and sentences are excellent and you are my master
I love you
I’m glad my website is useful for you 🙂
Hi Liz
In all your sample writing tasks the first sentence says illustrates. can we use elucidates or exhibits instead of illustrates?
Why do you want to change the word? You only need to write one report in the test. IELTS usually use “gives information about” and you paraphrase as “illustrates” – nothing more is needed. Don’t give yourself extra work for no reason when you prepare for IELTS. There are many more important aspects to learn and prepare for.
I agree , what i understand after following the way you explain the things (which is amazing) , we need to learn the basic about representing the information. going for extra attractive words can make the things more complicated
The graph also has a minor error in that it should say “Low- & reduced-fat spreads,” and not, “Lowfat & reduced spreads,” since “lowfat” is not recognized by any dictionary as a single word and “reduced spreads” is really more of a concept than a thing that actually exists and whose consumption can be measured. I’d like to get to the bottom of who this “unknown source” is. Just (mostly) kidding. My mom’s an editor and I can’t help myself. More importantly, I love this site! It’s a huge help with those of my students who are prepping for the IELTS. Thanks, Liz!
Thanks for your input, Todd. The problem here is that this is all about IELTS. You can’t alter the category titles given on a graph. You can adapt capital letters to make sentences grammatically correct, but you can’t alter the category headings. Just as you can’t alter data because it doesn’t make logical sense (which has happened in an IELTS graph before – you’d be surprised at what has turned up in IELTS tests). So, for this, candidates must stick with what has been given in the graph and work with it. About the source, there are many IELTS graphs floating around online without a known source of origin – this is one of them. It provides a useful lesson for candidates to see how to tackle a line graph report. Glad you like the site and that it’s helping your students 🙂
Your the best teacher
Thanks Liz. You are a great teacher.
Bless you.
Thanks 🙂
Hi, Liz! I am grateful to ensure myself with your materials, posts, suggestions and etc. My question is related to calculation.
1. Units are/were measured in grams…? Are or were? Which one is correct? Since, nowadays, such index maybe be measured in another type of calculation. The line graph is given in the past simple. Thanks in advance for your explanation.
How the units are measured is always in the present because it refers to what you see rather than the data given in the past. It will always be “Units are measured in …”. However, you only use this if you haven’t already given the units in the previous statement. For example, “The graph illustrates the proportion of …” – this already shows the units are in percentage so you don’t need to repeat it.
Hi, Liz! I am grateful to ensure myself with your tips, materials, posts and etc. My question is concerning overview point and the sentence related to calculation.
1. Can I start mine overview like this “Overall, a glance at the graph reveals that…”””
2. The line graph or bar chart is given in thepast simple, for instance in 2000. Under this circumstance, how should I say “”the statistics were/are measured in smth”””” which one is best option were or are?
“a glance at the graph” is not recommended to use. Firstly it seems as though you are trying to push unnecessary language into your report, which is supposed to be a highly focused report. Secondly, your task is not to glance but to analyse. Always try to avoid using words that are not necessary – it won’t help your score in IELTS.
Thank you so much! I will follow your advice.
hi! Liz hope you doing good
i just wanna ask that i have given IELTS test 3 times and still not getting good bands in reading and writing i have worked so hard but i m loosing hope for getting good bands and i don’t know my mistakes so what should i do
PLEASE REPLY!
Firstly, review your understand of the techniques and requirements of IELTS higher band scores. Unless you understand what the examiner is looking for and what influences your score to go up or down, you won’t improve. You can use my free tips and model essays on this page: https://ieltsliz.com/ielts-writing-task-2/. I also offer Advanced Writing Task 2 Lessons which are very detailed and are aimed to help people push their scores higher by explaining step by step how to create a high band score essay: http://subscriptions.viddler.com/IELTSLizStore
Hi Liz,
Pls give me a reply.
For a graph with no dates we use present tense. But if it’s a survey report with no dates??? The survey is done already, then is it past tense or present tense?
I’m totally confused, i don’t have any tutor to ask. Pls give me a reply and thank you in advance
If there is any mention that the data in the table, graph, map, chart etc is in the past, you use past tense. If there is no indication, you use the present tense. IELTS is not a trick test. Just apply logic and common sense in all situations. English grammar rules are not different because it is IELTS.
Hi Liz
why you have not compared the figures through body paragraphs?
Because it is not necessary to do so with a line graph. A comparison can be given in the overview. This is similar to diagrams – they frequently do not contain comparisons. You only compare where necessary.
Thank You Ma, your website have been of great help to me.
Pls Ma how should i construct the paragraph when writing.
Should i leave a full line and start a new paragraph or should i go to the next line then give a few space before writing.
Your aim is to make it easy for the examiner to see your paragraphs. There are no fixed rules on how to do that. Leaving an empty line between paragraphs is the most effective way.