It is possible to be given two charts together in IELTS writing task 1. Below you will see two pie charts followed by a bar chart. This exercise will focus on how to structure your report and how to highlight the key features of both charts in one overview.
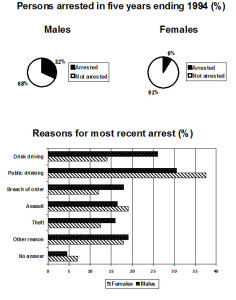
The charts below show the males and females arrested over 5 years and the reasons for the most recent arrests.
Source: The above charts were not created by IELTS Liz.
Two Charts: Structure and Overview
Answer the questions below in order to decide your paragraphing for your task 1 report.
- Will you put the introduction separately?
- Will you have an overview or conclusion?
- How many body paragraphs will you have?
- What order will you put your paragraphs in?
- Will your body paragraphs be equal lengths?
- Yes, the introduction should go in a separate paragraph.
- You must have an overview not a conclusion. The overview can go after the introduction.
- You should have 4 paragraphs in total.
- You should have an introduction, an overview, one body paragraph for the pie chart detail and one body paragraph for the bar chart detail.
- The body paragraph with pie chart detail will be shorter than the body paragraph with details about the bar chart
Now write your overview. this paragraph must contain key features from both charts. This means you must write one sentence about the key features of the pie charts and one sentence for the key features of the other chart. After you have written your overview, check the sample overview. Model Overview
Overall, over the five year period finishing in 1994, there were significantly more males arrested than females. The majority of arrests were due to public drinking while no answer was given for the least number of arrests for both genders.
Recommended
- Pie chart lesson in easy steps – a complete report, click here
- Bar chart model: Band 9
- Pie Chart Model: Band 9
- How to Describe a Bar Chart: Essential Tips Video Tutorial


