Useful tips and link for vocabulary, content & paragraphs for IELTS writing task 1 line graphs.
Below I have listed some useful links to learn about IELTS line graphs. Line graphs are quite common in IELTS writing task 1.
There are six types of IELTS writing task 1 for the academic paper:
- line graph
- bar chart
- table
- map
- diagram
- pie charts
Sample IELTS Line Graph
Source: IELTS Cambridge English Test Books
You must prepare for all types of charts in academic writing task 1. You might also be given a combination of a line graph with a table for example. Writing task 1 is worth about 33% of your total writing marks so it’s worth learning well.
Tips for IELTS Line Graphs
Here are some useful tips for Line Graphs:
- Introduce the time frame and individual categories
- the overview will contain the main trends over the whole period – a bird’s eye view
- use language of change for line graphs: increase, drop, fluctuate etc (see below)
- vary your sentence structures: “the number of sales decreased over the period / there was a decrease in the number of sales …”
- support sentences in the body paragraphs with data – time frame and numbers
- don’t spend more than 20 mins on task 1
- make sure you have four paragraphs (occasionally five are possible)
- don’t overload your writing with small details – be selective
- aim for between 160 and 180 words
- task 1 is a report, not an essay
IELTS Line Graph Lessons
Click on the links below to access the pages to learn about line graphs:
- Nouns and Verbs for IELTS Line Graph
- Adjectives and Adverbs with Tips
- both the above links provide useful language to describe the changes in a line graph.
- Gap Fill Practice for Line Graph
- Two Lines Model Answer Exercise
- both the above links are exercises to practice using language for line graphs.
- Three Lines Model Answer
- Line Graph & Bar Chart Model
- both model answers above will help you understand more about describing line graphs
- Practice Charts for Academic IELTS Writing Task 1
- All my IELTS Writing Task 1 Tips & Model Answers


dear LIZ
in the computer delivered IELTS, how do i use indentation? or does it not matter?
For both paper based and computer based tests, it is better to leave one line empty between paragraphs rather than indent.
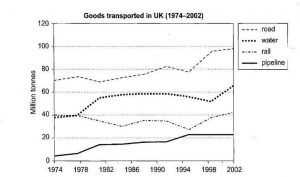
the line graph illustrates the quantity of goods that were moved through four different means of transportation(road, water, rail and pipeline) in the UK over 28 years, from 1974 to 2002. Units are in million tonnes.
Overall, there was a net increase in the volume of goods conveyed by road, water and pipeline during the period given whereas the volume remained unchanged for rail transport. Road transport was the most popular during the period under review while pipeline was the least favourite.
In 1974, about 70 million tonnes of goods were transported by road. This figure experienced fluctuations over the next 21 years, hitting 80 million tonnes in 1995 and thereafter rising to approximately 100 million tonnes in 2002. likewise transport through water and pipeline experienced almost similar fluctuations from their respective 1974 volumes of about 40 million tonnes and 5 million tonnes, ultimately increasing to about 65 million and 22 million tonnes respectively in the final year.
The quantity of goods transported by rail, on the other hand, did not show a net change over the given period. It started at 40 million tonnes in 1974 and fell slowly to a low of 25 million in 1994 and thereafter rising back to the initial volume of 40 million tonnes in 2002
Hi Liz Kindly Critique me!
Hey ma’am, I was wondering in this graph what would be the overall trend comparison of goods by roads with pipeline or the increase in all three except by rail?
Why do you think you need to choose. An overview needs to be full with all key features. There will often be two key features. What goes up/down and which is higher or lower.
The line graph illustrates the goods transported in the UK by Million tonnes from the year 1974 – 2002.
Overall, majority of the goods that are transported in the UK was done thru driving at the roads. Second most used mode of transportation was thru the ocean and seas, followed by railways and lastly was thru pipelines.
Almost 70 million tonnes of goods are moved throughout the UK using roads in 1974 and the trend rose another 10 million by 1991 and fell down by 5 at 1994 but rose up again reaching the highest at almost 100 million tonnes goods by year 2000. Moving goods by thru the water started at 40 abd had a sharo increase by 1982 which remained constant for 12 years. Moving things by rail started almost same number with water but fell 10% less twice during 1985 and 1994 but rose up from 1995 to 2002.
Lastly, pipeline has the lowest number of all only having thrice less than compared to using the road.
OR
The line graph illustrates the proportion of goods transported by road, water, rail and pipeline in the United Kingdom between 1974 to 2002. Units are measured in million tonnes.
Overall, the preferred mode of transportation of goods in the UK was by road, while pipeline was the least used. Furthermore, there was considerable increase in the utilization of all methods of transit over the given period except for rail which only had a slight increase.
In 1974, about 70million tonnes of goods were transported by road and this figure experienced some fluctuations before reaching a peak of slightly under 100million tonnes in 2002. In contrast, pipeline was the least utilized route, with an attributed figure of about 5million tonnes at the beginning of the given period, followed by a gradual but steady rise until around 1994 where it reached a plateau slightly above 20million tonnes until 2002.
Both water and rail accounted for the movement of goods slightly under 40million tonnes and 40million tonnes respectively. However, the use of water rose higher than rail in 1978 followed by a dramatic increase to more or less 60million tonnes in 1982 before reach a highest point marginally over 60million tonnes in 2002 while rail transport showed several upward and downward slopes before finally peaking at a figure slightly above 40million tonnes.
Thankq dear LIZ madam,your tutorials are really helpful,just one thing i would like to say is to add a bit more of writing task 1 graphs along with their answers…the different types of graphs(more of those complex one and past solved questions on graphs that came in ielts) that could probably come under WT1 along with their answers..it will be really helpful if u do so.
Warm regards,
Harjot singh
Did you see all the model answers for writing task 1 on the main page? There is a model answer for each type of task 1.
Thank you very much Liz!
Hi Liz,
I want to know for the Reading section if i write T/F/NG instead of True/False/Not Given, will the examiner treat it as wrong answer?
It is fine.
Thank u Mam . Good explanation.
appreciate your support
hello mam..I have written more than 200 words in task 1 and more than 450 words in task 2…so will it affect my score negatively ?? ….(However,I have written everything related to the topic)
Yes, it will affect your score. The IELTS essay must be focused and every sentence highly relevant. If you wrote over 450 words than you probably wrote a less focused essay which will lower your score.
Many thanks Liz.
Your emails woke me up and brought me to work back more and more.
As i am working so hard and sonetimes i forget to put my self into elts pratice and focus to reach my goals and use my professional qualification.
You are the Best Ever for IELTS, Love from Baghdad 🙂
Thanks 🙂
Thax u so much mam
Thank you so much dear LIZ!
You’re welcome 🙂
Many thanks dear Liz, I appreciate your efforts. .
You’re welcome 🙂