Below are sample IELTS charts to practise writing task 1 at home. In the IELTS writing task 1 (academic paper), you will be given one of the following and will have 20 mins to write a full report:
- bar chart
- line graph
- table
- pie chart
- diagram or process
- map
- combination of the above (multiple tasks)
This collection of IELTS charts represents the main types of charts that you can be given in writing task 1, including tasks with two or three charts combined. Please remember that writing task 1 is not an essay, it is a report.
Use the sample practice charts, tables and diagrams below to practise and develop your IELTS writing task 1. Some charts below have links to model answers. Charts not created by myself have the known source stated when possible.
Practice Charts for IELTS Writing Task 1
You must write a report of over 150 words
You have 20 mins for this task
IELTS Bar Chart Practice Samples
The bar chart below shows the percentage of people who ate five portions of fruit and vegetables per day in the UK from 2001 to 2008.
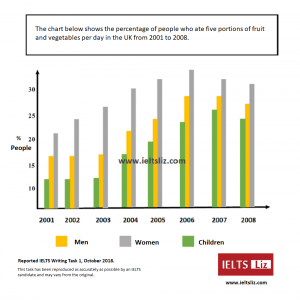
- Source: IELTS Liz, Reported by IELTS Candidate
- Download: IELTS Writing task 1 October 2018
- Model Answer: Answer
The bar chart below shows the hours per week that teenagers spend doing certain activities in Chester from 2002 to 2007.
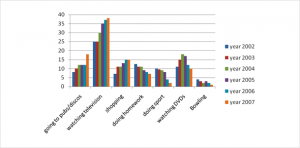
- Source: English-in-Chester
- Model Answer: Answer
The chart below shows the global sales of different kinds of digital games from 2000 to 2006.
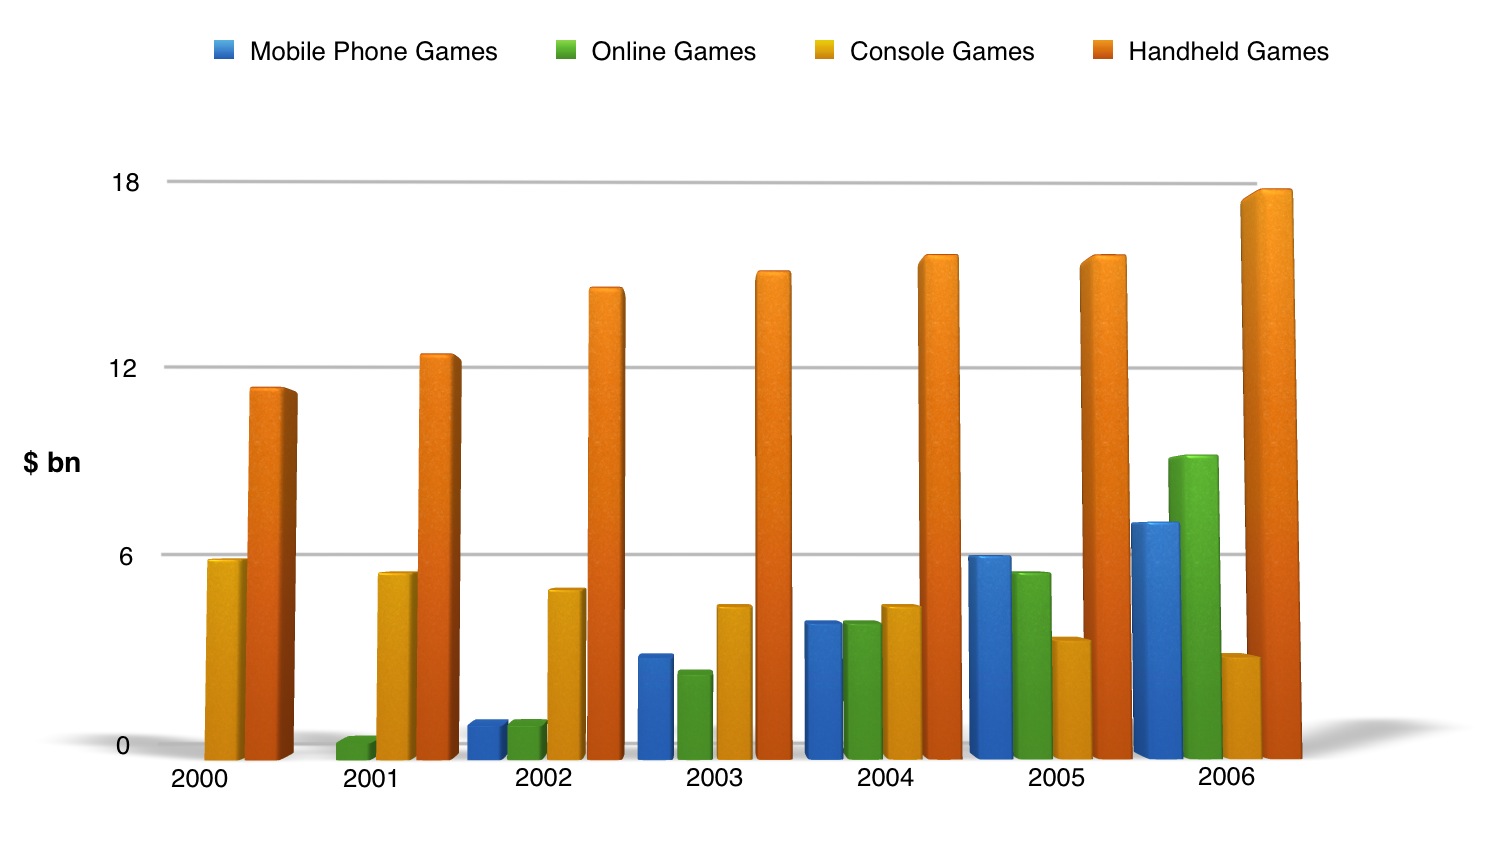
- Source: Chart not by IELTS Liz. Source unknown.
IELTS Line Graph Practice Samples
The graph below shows the population figures for different type of turtles in India from 1980 to 2012.
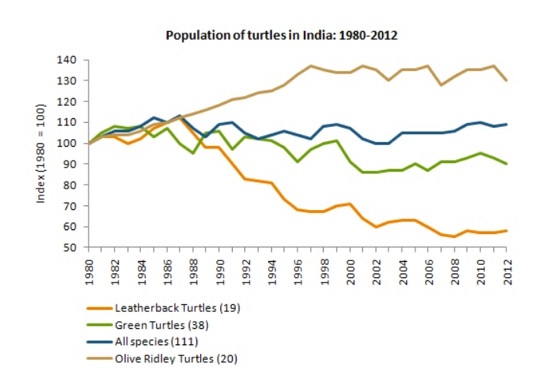
- Source: Graph not designed by IELTS Liz. Source unknown.
The graph below shows the amount of goods transported in the UK from 1974 to 2002.

- Source: IELTS Cambridge English Test Books
- Useful Tips: Tips
The line graph below shows the consumption of 4 kinds of meat in a European country from 1979 to 2004.

- Source: IELTS Cambridge English Test Books
IELTS Table Practice Samples
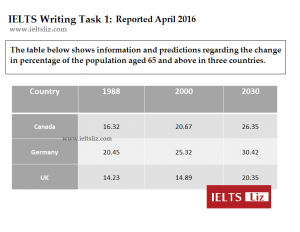
- Source: IELTS Liz, Reported by IELTS Candidate
- Model Answer: Answer
The table below shows the proportion of income spent on 4 common items in the UK in 1998.
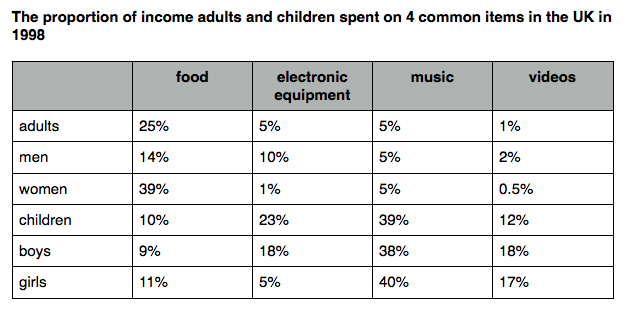
- Source: Table not designed by IELTS Liz. Source unknown

- Source: IELTS Liz, Reported by IELTS candidate
- Model Answer: Answer
The table below gives information about the underground railway systems in 6 countries.

- Source: IELTS Cambridge English Test Books
The table below shows consumer spending on different items in 5 countries in 2002.
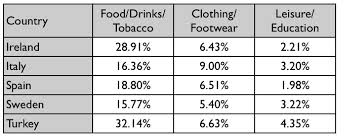
- Source: IELTS Cambridge English Test Books
- Model Answer: Answer
The table below gives information about the employment sectors in which people from 3 age groups worked.
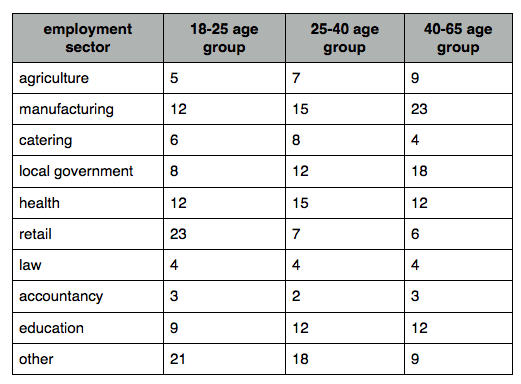
- Source: Table not designed by IELTS Liz. Source unknown
IELTS Pie Chart Practice Samples
The pie charts below show the average household expenditures in a county in 1950 and 2010.
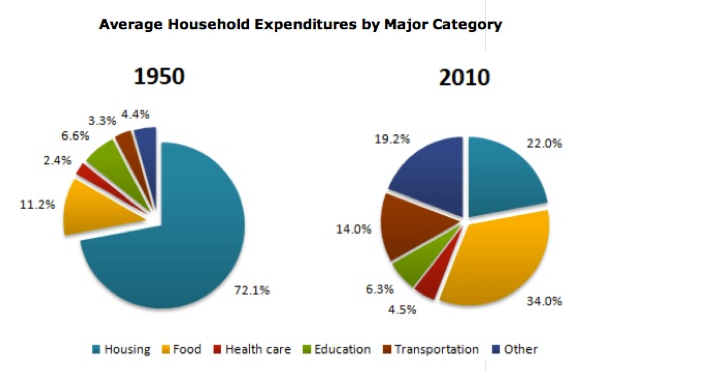
- Source: Charts not designed by IELTS Liz. Source unknown.
The charts below show the percentage of students joining North West University.

- Source: Charts not designed by IELTS Liz. Source unknown.
The charts below give information about the electricity generation in two countries in 2009.

- Source: Charts not designed by IELTS Liz. Source unknown.
The pie charts below show the spending of a school in the UK from 1981 to 2001.
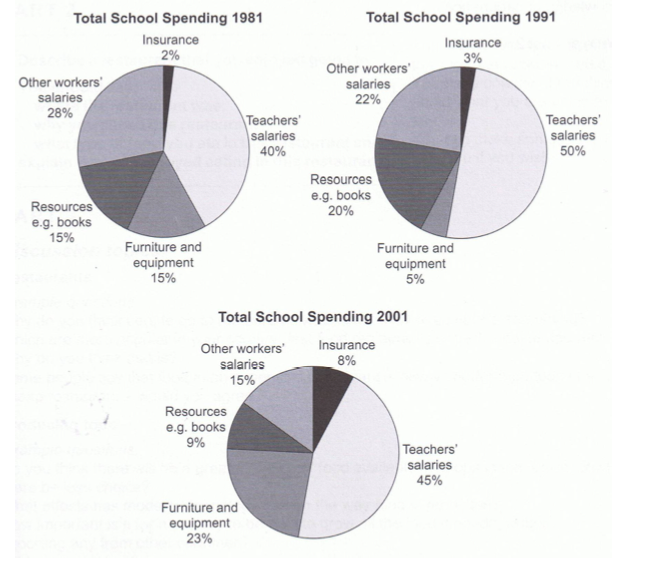
- Source: IELTS Cambridge English Test Books
IELTS Diagram Practice Samples
The diagram below shows how rainwater is collected for the use of drinking water in an Australian town.
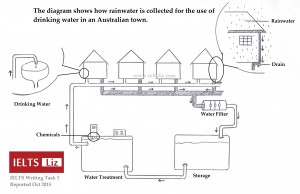
- Source: IELTS Liz, Reported by IELTS Candidate
- Download:
- Model Answer: Answer
The diagram below shows the water supply in Australia at present and in the future.
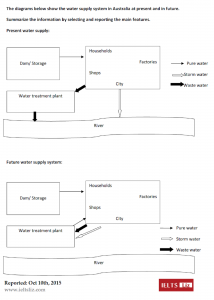
- Source: IELTS Liz, Reported by IELTS Candidate
- Model Answer: Answer
The diagram below shows how the water cycle works.

- Source: New Insight into IELTS
- Although this book was published years ago, I still recommend it for practise at home.
The diagram shows the process of making coffee.
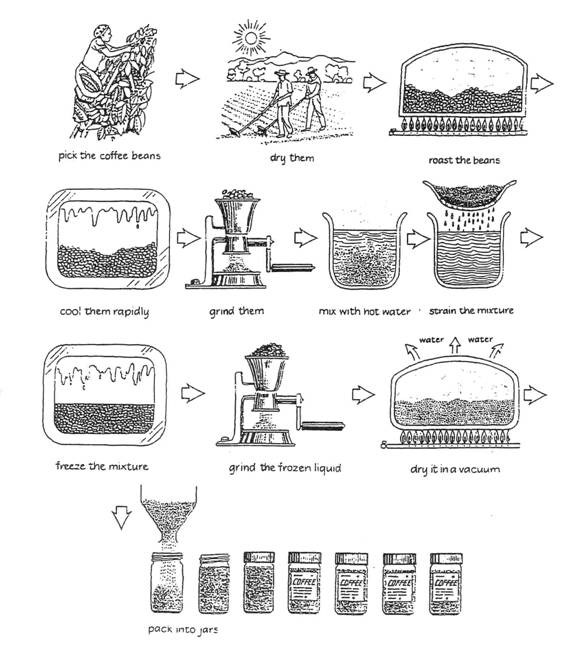
- Source: Diagram not designed by IELTS Liz. Source unknown.
The diagram below shows how coal is used to generate electricity.
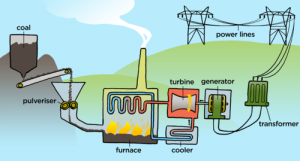
- Source: mstworkbooks.co.za, natural sciences.
IELTS Map Practice Sample
The maps below show an island, before and after the constructions of some tourist facilities.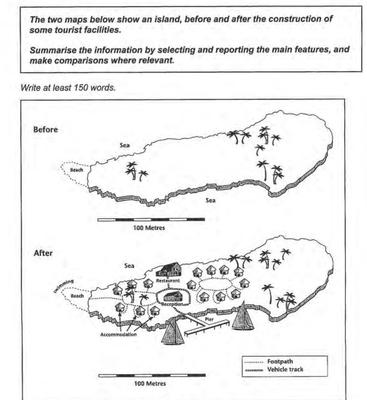
- Source: IELTS Cambridge English Test Books
IELTS Multiple Charts Practice Samples
Two Bar Charts
- Source: IELTS Liz, Reported by IELTS Candidate
- Download PDF: IELTS 2017 Writing Task 1
- Model Answer: Answer
Bar Chart & Two Pie Charts
The charts below give information about levels of education in Glasgow, a city in Scotland, in 2010.
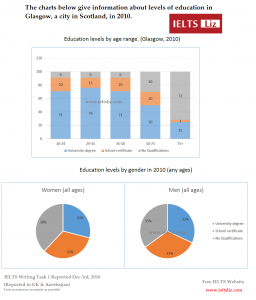
- Source: IELTS Liz, Reported by IELTS Candidate
- Model Answer: Answer
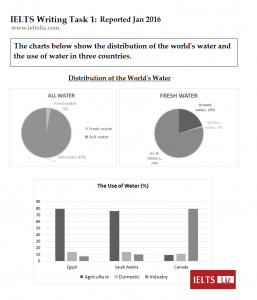
Table & 3 Pie Charts

- Source: IELTS Liz, Reported by IELTS Candidate
- Model Answer: Answer
Two Pie Charts & Bar Chart
- Source: IELTS Liz, Reported by IELTS Candidate
- Model Answer: Answer
Useful Links for Free IELTS Preparatio
IELTS Writing Task 1: Tips, Answers, Vocabulary & Videos
IELTS Writing Task 2: Model Essays, Linking Words & Videos
All the best
Liz