IELTS Line Graph Vocabulary

Essential vocabulary to describe an IELTS writing task 1 line graph. To get a good band score you must show the examiner a range of different words to show upward and downward trends as well as key features. IELTS line graphs show change over a period of time and you must vary your language and vocabulary when you write your report.

This page contains:

  1. Verbs & Nouns
  2. Practice Exercise
  3. Adverbs & Adjectives
  4. Time Phrases
  5. Useful link to model answers and more tips for line graphs

1. IELTS Line Graph Verbs & Nouns

Below are lists of verbs and nouns that can be used to describe a line graph in IELTS writing task 1.

Upward trend

  • rise / a rise
  • increase / an increase
  • climb / a climb
  • grow / a growth
  • go up

Downward trend

  • decrease / a decrease
  • drop / a drop
  • fall / a fall
  • decline / a decline

Other vocabulary

  • fluctuate / a fluctuation
  • dip / a dip
  • remain steady
  • remain stable
  • remain unchanged
  • level off
  • peak at
  • reach a peak of
  • hit a high of
  • hit a low of
  • bottom out
  • plateau

Mistakes when using words will affect your band score. This includes spelling.

  • Band 6 = some vocabulary errors.
  • Band 7 = few vocabulary errors.

2. Practice with Nouns and Verbs

Fill in the gaps using the vocabulary above. Make sure you adapt the words to make the sentences grammatically correct. The completed paragraph below is an example of a body paragraph for a line graph.

  • Source: IELTS Liz
  • Notice: It is uncommon to be given only one line as a task unless it is combined with another chart or table. The above graph is for practising vocabulary.

Questions 1-5

Fill in the gaps with the correct vocabulary. You should use no more than two words for each gap.

The number of reported cases of influenza began at 40 in 1985 after which the figure (1). …………………… steadily to reach about 55 in 1987. In 1988, there was a (2) …………. in the number to below 50 before (3) ……………. to reach a (4) …………  (5) ……….. approximately 75 in 1991. After that date, the figure dropped to about 55 in the final year.

Answers

Click below to reveal the answers:

Answers
  1. rose / increased / climbed / grew / went up
  2. a fall / a decline / a drop / a dip / a decrease
  3. climbing / increasing / rising / going up / growing
  4. peak
  5. of

3. Line Graph Adverbs & Adjectives

Below are useful adverbs and adjectives to describe change.

Adverbs: steadily, gradually, sharply, rapidly, steeply, slightly, dramatically, significantly, considerably

Adjectives: steady, gradual, sharp, rapid, steep, slight, dramatic, significant, considerable

Sentences:

  1. The number of cases of influenza increased steadily from 40 to 55 in the first  three years.
  2. There was a steady rise in the number of cases of influenza to reach 55 in 1987 from 40 in the first year.

4. Time Expressions

IELTS line graphs show change over  a period of time. Below are some expressions to help you describe the passing of time without too much repetition.

Time phrases:

  • over the next three days
  • three days later
  • in the following three days
  • the next three days show
  • over the period
  • from…to… / between … and…
  • the last year
  • the final year
  • the first year
  • at the beginning of the period
  • at the end of the period

5. Recommended Links for more IELTS Writing Task 1

IELTS Writing Task 1: Tips, Model Answers and More

Full Model Answer and Guidelines for IELTS Line Graph

All other free materials are found on the RED BAR at the top of this site.

All the best

Liz


Subscribe for Free to get New Post by Email

IELTS Model Answer Bar Chart October 2018

IELTS bar chart model answer for writing task 1 October 2018

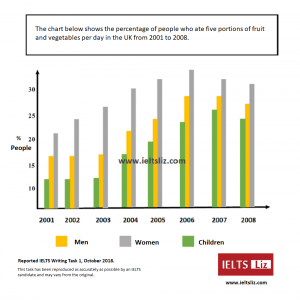
This bar chart appeared in IELTS writing task 1 this month. The model answer below will help you understand how to organise your ideas and support your statements with data. Also check the 10 useful tips below to help you understand the model answer better.

You can download the bar chart above here: IELTS Writing task 1 October 2018

IELTS Model Answer Writing Task 1 Oct 2018

The bar chart illustrates the proportion of women, men and children consuming five servings of fruit and vegetables each day in 8 years from 2001 to 2008 in the UK.

Overall, it can be seen that the highest percentage of all people consuming fruit and vegetables was women, while children consistently accounted for the lowest proportion. Furthermore, a significant increase in the proportion of people eating these food items can be seen over the period given.

The percentage of women who ate fruit and vegetables started at just over 20% in 2001. This figure then rose steadily to reach a peak of almost 35% in 2006, before falling slightly to 30% in the final year.

In terms of men and children eating fruit and vegetables, the rate remained relatively stable in the first three years (about 17% and 12% respectively). From this point, the proportion of men climbed gradually to peak at about 27% in both 2006 and 2007, after which it dropped to about 26%. A similar growth in the figure for children was evident reaching 25% in 2007 and around 24% in the final year.

Tips for Analysing the Model Answer:

  1. Paraphrasing does not need to be complicated. Not all words can be changed all the time. Choose which words you will and won’t change. Trying to paraphrase too often will result in too many errors and a lower score.
  2. Highlight highs, lows and trends in your overview where possible.
  3. Make sure statements in your body paragraph are supported by data.
  4. Make sure paragraphs are easy to see.
  5. Remember this is a report, not an essay
  6. Look at the logical organisation of information in the model answer above. It is easy to read and not confusing. If your report is confusing to read because you jump about with information, it is a bad report. All reports should be logical and clear.
  7. Check the linking words used.
  8. Note the variation in sentence structures.
  9. Don’t overload your report with too many small details – be selective.
  10. Aim for around 170-190 words. This model answer is 184 words in length. You do not need to write your word count on your test paper.

I hope you found this useful. For more tips and lessons, go to the RED BAR at the top of the website and see the relevant section of the test.

Please note, GT candidates have a letter in task 1 and nothing else.

All the best

Liz


IELTS Writing Task 1 Bar Chart October 2018

This IELTS writing task 1 bar chart (October 2018) was reported and reproduced by an IELTS candidate. It appeared in the IELTS test three days ago. You can download a pdf copy below.

IELTS Writing Task 1 October 2018

Download: IELTS Writing task 1 October 2018

Model Answer

A model answer is now available for this writing task 1.

Click here: MODEL ANSWER FOR TASK ABOVE

All the best

Liz

IELTS Writing Task 1: Introduction Errors

IELTS Writing Task 1 Introduction Paragraph – learn what mistakes to avoid. The introduction should be short and factual based on the information given. It should also be the quickest part of task 1 for you to write. 

Look at the graph and introduction paragraph below. Then answer the questions.

comp-ownership-graph

Source: The above chart was not created by IELTS Liz.

Introduction Paragraph

Look at the introduction below and spot the mistakes.

Introduction: 

The graph give the information about the number of computer ownership by education level in two different years.

Questions:

  1.  How many mistakes are there in the introduction above?
  2. How would you write the introduction?

ANSWERS

Click below to reveal the answers and a model introduction.

Answers
  1. The graph = The bar chart
  2. give = gives (s)
  3. gives the information about = gives information about (no “the”)
  4. the number of = the percentage of / proportion of
  5. computer ownership by education level = copied from graph. Do not copy phrases from the question paper. You can use the words, but change the order or paraphrase where possible.
  6. in two different years = always provide full information. Give the precise dates
Model Introduction

Model Introduction

The bar chart gives information about the proportion of people from five different levels of education who owned a computer in two different years (2002 and 2010).

Model Introduction Comments: As you can see, the first words are not altered because they are not required to be paraphrased. A bar chart is a bar chart. However, the verb is paraphrased and the rest of the information is reworded. As the education levels are length to write, it is possible to give information about how many there are in your introduction. Regarding dates, you can use brackets in IELTS Writing Task 1 and you can see that the dates are given in the brackets in this introduction. 

.

Subscribe to get New Posts by Email

IELTS Diagram Paragraphs and Organisation

IELTS writing task 1 diagrams must be clearly organised with logical paragraphs. This is part of the marking criteria of Coherence and Cohesion which is 25% of your marks. Most IELTS diagrams show a type of process which is divided into stages or given as a cycle. Also remember that writing task 1 is a report, not an essay.

You must organise your IELTS diagram into different paragraphs. Look at the process below and then answer the questions to learn about organising information.

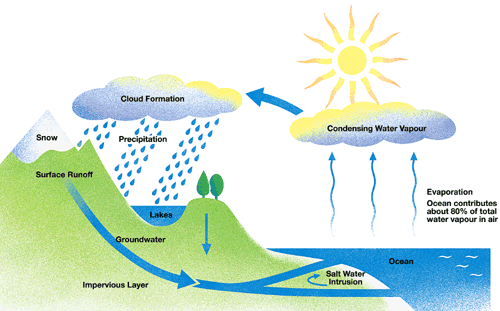
IELTS Water Cycle Diagram:

IELTS_Writing_Sample_Task_1_Water_Cycle

Source: Diagram not designed by IELTS Liz.

Questions 

Learn to analyse and organise your IELTS diagram by answering the following questions:

  1. How many paragraphs would you have in your report?
    1. Tips: Never have only one body paragraph.
  2. What information would you put in each paragraph?
    1. Tip: Use the arrows and always organise the information logically.

Answers

Read the answers very carefully and look at each point given in the diagram. Click below to reveal the answers:

Answers

1. There should be 4 paragraphs for this report.

2. You should put the following information in each paragraph:

  • Introduction: You need to introduce the content of the diagram (the process of the water cycle).
  • Overview: Put the key stages in this statement (a continual cycle of evaporation, cloud formation, rain and water returning to the sea).
  • Body paragraph A: Water in the ocean, evaporation, condensing water vapour and cloud formation.
  • Body Paragraph B: Precipitation, rain or snow, lakes, surface run off, ground water, impervious layer and salt water intrusion. You also need to note that at the water cycle starts again as the water returns to the ocean.
    • For the body paragraphs, you need to describe each stage in detail using full sentences linked together. You should divide the body into two or three paragraphs for all diagrams.

Example Introduction and Overview

The diagram illustrates the key stages in the water cycle.

Overall, the water cycle is a continual process of water evaporating and forming clouds which then return the water to the land and sea in the form of rain.

  • Note: You can see that the introduction is short and brief. You can see that the overview contains the key words as well as the key stages in summary.
  • It is possible to put these two sentences into one paragraph.


For model answers for writing task 1 and more tips, see this page: IELTS Writing Task 1 Model Answers & Tips

To see a model answer for an IELTS Diagram, click here: IELTS Diagram Model Answer

All the best

Liz

Full Model Answer to Bar Chart Lesson

Creating a Model Answer for IELTS writing task 1.

Many students asked me to write a full model answer for this bar chart which was used in my lessons last week.

Below you will find 10 sentences. Put them in order to create a high band score model answers.

Source of Bar Chart: https://www.english-in-chester.co.uk

IELTS Bar Chart Model: Sentence Ordering

Put the sentences in order to make a full answer. Download Sentences: bar chart model lesson

  • A) Teenagers spent 25 hours on watching television in 2002 which increased to almost 40 hours in the final year.
  • B) The other pursuits showed a decrease in hours, except watching DVD’s which fluctuated.
  • C) Going to pubs and discos, watching TV and shopping all showed an increase in the number of hours teenagers spent on these activities.
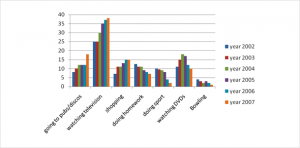
  • D) The bar chart illustrates how many hours adolescents in Chester spent on seven activities each week between 2002 and 2007.
  • E) While teenagers occupied 10 hours doing homework in 2002, this figure dropped to just over 5 in 2007.
  • F) The number of hours teenagers dedicated to watching DVD’s was only 10 hours in first and final years, but reached a peak of over 15 hours in  2004 and 2005.
  • G) Overall, the most popular activity over the period given was watching TV, whereas bowling was the least favourite.
  • H) Bowling was under 5 hours throughout the entire period declining by about 4 hours in total.
  • I) Both going to pubs and discos, and shopping more than doubled in hours from over 5 to over 15 and from over 5 to exactly 15 respectively.
  • J) Playing sport fell more dramatically from 10 hours to around 3 hours.

Notice how many sentences are used to create a full model answer. IELTS writing task 1 does not require many sentences. There are NO fixed number of sentences for writing task 1, but you can see that you do not need many to write a high score answer.

Answers

Answers are now available.

Click below for the Answers

Answers

D, G, C, B, A, I, E, J, H, F

The bar chart illustrates how many hours adolescents in Chester spent on seven activities each week between 2002 and 2007.

Overall, the most popular activity over the period given was watching TV, whereas bowling was the least favourite. Going to pubs and discos, watching TV and shopping all showed an increase in the number of hours teenagers spent on these activities. The other pursuits showed a decrease in hours, except watching DVD’s which fluctuated.

Teenagers spent 25 hours on watching television in 2002 which increased to almost 40 hours in the final year. Both going to pubs and discos, and shopping more than doubled in hours from over 5 to over 15 and from over 5 to exactly 15 respectively.

While teenagers occupied 10 hours doing homework in 2002, this figure dropped to just over 5 in 2007. Playing sport fell more dramatically from 10 hours to around 3 hours. Bowling was under 5 hours throughout the entire period declining by about 4 hours in total. The number of hours teenagers dedicated to watching DVD’s was only 10 hours in first and final years, but reached a peak of over 15 hours in 2004 and 2005.

Word count = 194 (you do not need to write the word count in your test)

Paragraphing Tips

  • It is possible that the last sentence about DVD’s could be written as a separate paragraph.
  • Always have an introduction and overview. They must be separate statements.
  • Always divide your body paragraphs into two (or sometimes three) paragraphs.
  • Your body paragraphs should be logical and help to highlight similarities and differences.
  • Learn an empty line between paragraphs to make them clear and easy to see. This is not a requirements, it is a recommendation. If your paragraphs are not easy to see, your score might be lower.


All the best, Liz


Organising Information in Bar Chart

Do you know how to organise information in an IELTS bar chart? Bar charts are common in IELTS writing task 1 academic paper.

You must be able to organise details into body paragraphs in IELTS writing task 1. Some people find this difficult to do when there is a lot of information in the bar chart. Writing task 1 is not an essay, it is a report which needs to be concise and highly organised.

Remember that 25% of your marks for writing task 1 is about your paragraphing, organising and linking methods. Planning your paragraphs is essential.

Check your organisation skills

The bar chart below shows the hours per week that teenagers spend doing certain activities in Chester from 2002 to 2007.

Source of Bar Chart: https://www.english-in-chester.co.uk

Questions for You

  1. How many paragraphs would you have?
  2. How would you organise the categories into body paragraphs? Which categories go into which body paragraphs?

Answers

The answer to this lesson is now available.

CLICK HERE FOR ANSWERS: Answers to bar chart organisation

All the best

Liz


Is the Overview Important in IELTS WT1? Answers

IELTS Writing Task 1 Overview (Academic Paper): Tips, Videos and Answers

Do all types of writing task 1 have an overview?

Yes. ALL TYPES of writing task 1 for the academic paper should have an overview. The types are listed below.

  1. bar chart
  2. pie chart
  3. table
  4. line graph
  5. map
  6. diagram (process)

All the above types MUST have an overview.

What is an Overview?

  • An overview is a statement or statements which contain all the key features in the task given to you.
  • It is important that the key features are collected in one overview and not put in different places.
  • An overview will contain all features – this means if you have two charts, there is only one overview which contains the key features for both tasks.
  • You are marked on your ability to choose the key features. Each task will be different.

Is the Overview Important?

Yes. It is the most important paragraph in your writing task 1 for the academic paper.

The overview is marked in the marking criterion of Task Achievement. This criterion counts for 25% of your writing task 1 marks. The examiner will look specifically for an overview in all types of writing task 1 (academic). See below:

Band 5 = no clear overview

Band 6 = presents an overview

Band 7 = presents a clear overview

You can see that your score will go up or down depending on your overview. If you miss the overview, you will get Band 5 or below in Task Achievement. If you are aiming for band 7, 8 or 9, you must have a clear overview with key features well selected and highlighted.

Learn more about the band score requirements of IELTS writing task 1 on this page: Band Score Tips & Info Writing Task 1

Overview or Conclusion?

See this video about the difference between an overview and a conclusion.

[su_youtube url=”https://youtu.be/zjzuxyVlkR8″]

Paragraphing: Where to put the overview?

See this video lesson to learn about the paragraphs for writing task 1, including where the overview should be put.

[su_youtube url=”https://youtu.be/TzLyARGcTEA”]

Model Writing Task 1 Answers

See this page to take a look at model answers for all types of IELTS writing task 1. You will see the overviews for ALL types of writing task 1. Model Answers and Tips: IELTS Writing Task 1

Hope this was useful 🙂

All the best

Liz

error: Content is protected !!